An April Air Pocket – No Fun, But Normal and Perhaps Even Healthy

Read time: 11 minutes
“Some things are believed because they are demonstrably true. But many other things are believed simply because they have been asserted repeatedly—and repetition has been accepted as a substitute for evidence.”
—Well-known economist and author Thomas Sowell
April just wasn’t any fun. The S&P 500 fell 4.2% in the month, its worst monthly showing since September 2023.1 But it was normal! After a surge of 50% off its October 2022 low, a 2023 gain of more than 26% and a stellar 10% advance in the first three months of the year, isn’t it time for a little rest?2 History would tell us, yes. Trees just don’t grow to the sky, and the stock market doesn’t go up each and every month.
After the historic Santa Claus rally last year and Q1 results that rank high on the list of best quarterly results on record, some were inquiring if we were planning to raise our S&P price target of 5,200 to 5,400 for calendar year 2024. Not now … those targets represent reasonable price-to-earnings multiples on healthy consensus earnings figures that are the product of more normal earnings growth following the 2023 earnings lull. Our target represents nice double-digit gains for the S&P 500. If investors decide to become giddy and drive the market above our targets, we’ll be happy to apologize to folks for their wealth exceeding our expectations—a delightful problem.
Back-to-Normal Thesis Prevails
It’s hard to believe that only a year ago, some thought it was lunacy for us to forecast a 5,000 handle on the S&P 500 in 2024. My, how moods shift. Investors were as skeptical back then as they were bullish at the end of March of this year. Again, patience, poise and moderation tend to be rewarded in this profession. The solid/normal and better-trending data has supported holding equity allocation at longer-term strategic targets throughout all the mood swings.
Once again, we see the fundamentals and valuation levels to be neutral to positive, and many metrics are normalizing per our “Back to Normal” thesis. This is true regarding expectations for steady gross domestic product growth this year versus recessionary fears of last year as well as trend in a number of key items, including: the pace in inflation; interest rate levels; labor productivity; supply-demand conditions in the labor market; activity levels in the service and manufacturing sectors of our economy; earnings growth and so on.
Stock Market Corrections Are Common
This normalizing and solid trend is also true for the technical conditions in the stock market. Specifically, the positive number of stocks advancing versus declining is constructive and confirmed by the fact that all 11 S&P 500 sectors have generated positive returns on a year-to-date basis, despite the modest pullback in April. Investor sentiment has cooled from extremely high bullish levels at the end of Q1 to more neutral or normal levels. Market momentum has retreated a bit as exhibited by a more normal or neutral percentage of stocks trading above their 50-day and 200-day moving averages.
The data doesn’t support being extremely greedy or fearful. Confident but centered and measured is the place to be right now based on the facts and data, as it is most of the time, versus the moments of exception such as in the 1930s, the 1970s, the 2000 tech implosion and the “Great Recession” of 2007/2008 when economic and market conditions were truly horrible and trending in a bad way. Decades separate these rare, sustained negative periods.
While we don’t celebrate pullbacks like April’s 4% decline, we think it is important to put it in context. We are still up over 5% for the year, which is a very nice start.3 In digesting our positive 2024 forecast, folks can forget that part of our theme of “Back to Normal” includes expectations of a normal correction of 10%+ that happens most every year in normal markets as seen in the chart below in data going back to 1980.
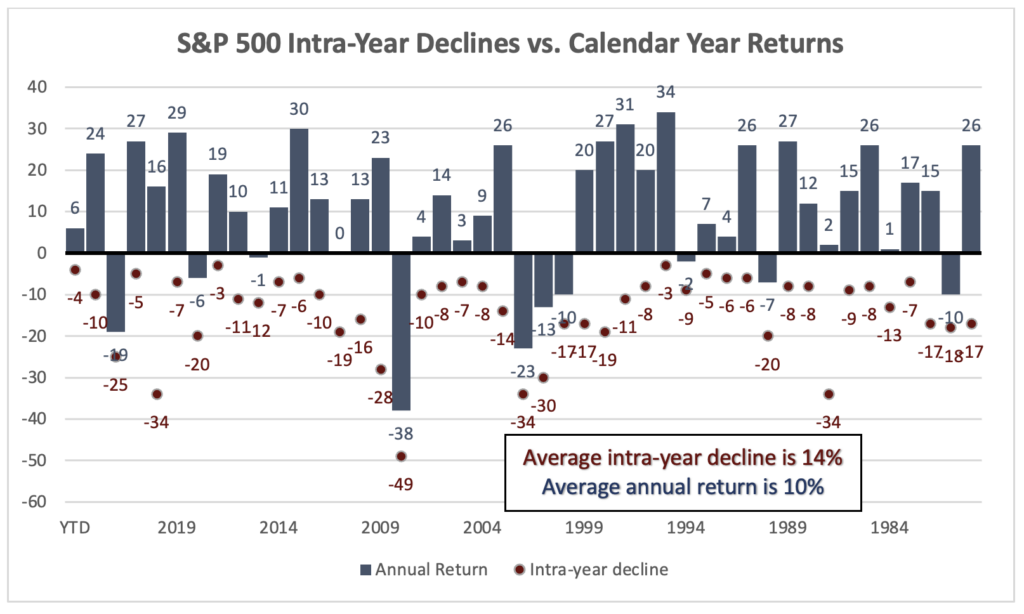
Source: FactSet as of 4/30/2024 for YTD; the first year is 1980.
So, intra-year corrective activity is part of the normal experience in most years when calendar year returns are positive and healthy. What might inspire such behavior? Election anxiety, campus demonstrations, geopolitical conflicts, etc., which are all drivers of volatility but seldom spill over and negatively impact true sustainable drivers of market direction and returns: earnings, trends in interest rates/inflation and associated policy, economic growth and credit conditions.
Update on Legacy Wall of Worry Items
Let’s examine some of the key factors that do matter, then, and include legacy issues that were front and center concerns in 2023—risk of recession, runaway inflation and potential Fed policy mistakes. We continue to believe these are seasoned and largely resolved, despite headlines in the media still implying otherwise. Given that we consider these true influencers of sustainable market trend, we provide an update on each below:
- Inflation Risk. Despite the last two months in which the inflation data has plateaued after falling slowly but consecutively since their peak in June 2022, we continue to see progress. Key contributors to the longer-term trend, such as rents, show slow but important progress.
Labor productivity is rising sharply and serves as a major offset to nominal wage inflation, and there are increasing signs of easing from the tight conditions in the labor force. We see fewer job openings, declining worker quit rates, fewer plans to hire and lower percentages of employers planning increases in compensation. In addition, the better-than-expected Producer Price Index data in March somewhat offsets the hotter Consumer Price Index data of that same month. However, it is important to note that one month does not make a trend—whether it’s in the positive or negative direction.
Additionally, certain contributors to the early 2024 inflation data are hard to trust or embrace as longer-term core drivers of price trends. Examples include volatile items such as insurance and medical costs as well as the current war-related premium in oil prices. The one true risk we do see here is an expansion in regional military conflict that could drive oil prices far higher than our current longer-term base case expectations assume and reignite heightened inflationary pressure on a more sustained basis. We believe this is a low probability event at present, but stay tuned.
- Rising Rates. The current 10-Year Treasury yield stands at roughly 4.6%, slightly below the 70-year historical average of 5.6% and comfortably within our expected range of 3.75% to 4.75%.4 Not only is this level of rates much healthier for retirees dependent on fixed income, but the stock market has also performed well over long periods of time at this rate level. It is only when rates surge above levels of 5% or higher that P/E’s tend to move in the opposite direction to yields and pose a major threat to stocks on a historical basis.5
Furthermore, the current level of rates and the belief that they could stabilize here is grounded in math. If inflation is calming to the 2.5% annualized level as the Fed thinks, the normal spread above that over the last 34 years going back to 1990 for the 10-year Treasury is between 1% and 2%.6 That would put the expected 10-year yield within a range of 3.5% to 4.5%, just about where the current 10-year stands. We view the risk of rising rates as the most important risk to the stock market and would become much more cautious should they unexpectedly surge well above the 5% threshold.
- Fed Policy Mistake/Recession Risk. As for the latter, both the Fed and our team here at Mariner look for real GDP growth of roughly 2% this year. Data for retail sales, for the manufacturing and service economy and for capital spending are all in a positive trend. The Fed just lowered its forecast for unemployment in 2024 from 4.1% to 4.0% as policymakers took their GDP forecast up.7 The economy is resilient and on solid footing—few signs of recession here, in our view.
This is a major reason why the Fed is under no pressure to have to do anything. We find all this rhetoric and speculation about what the Fed may or may not do to be melodramatic. It has enough evidence that inflation has calmed and that inflationary pressures are easing to begin the rate cutting process very slowly. However, given the strength in the economy, employment and earnings, the Fed doesn’t have to do anything!
At the beginning of the year, the bear camp was concerned that the fed funds futures curve was calling for six rate cuts when the Fed was signaling just three. The bears felt such a gap in “market expectations” versus Fed intentions was dangerous and would lead to a potential market meltdown. That was several hundred points ago in the S&P 500 price level. The market got comfortable that three Fed cuts were in fact just fine.
The fed funds futures market is highly volatile and unpredictable, and we remain skeptical about the reliability of drawing investment conclusions from its short-term fluctuations. We think it’s likely that the market will adjust and become comfortable with the possibility of either two rate cuts or no cuts at all this year, particularly if the Fed decides to hold off due to the strong economy and stabilizing inflation. While there could be a correction driven by uncertainty surrounding the Fed’s decision-making, we expect the market to eventually find its footing. Can we get back to looking at earnings and fundamentals, please?
Myths and Distortions: Stagflation – Not!
The reason for the sell-off in April was partly associated with several data releases related to inflation and economic growth. These releases have now become “Breaking News” on TV. Positioning/spinning them as popcorn-grabbing announcements amplify reaction around these moments, particularly when the broadcast commentary is exaggerated and distorted. As an example, media reports were actually suggesting the GDP data released at the end of April contained signs of stagflation. Unfortunately, once uttered in the press, such commentary can take on a life of its own and scare folks. Thankfully, these distorted comments have not gone viral, so far. It would be a shame if they did.
Stagflation? We think not! I listened to Fed Chairman Jerome Powell field questions regarding risk of stagflation at the recent Fed press conference and not only agree with his observations but also give him an A+ on his response. He believes such risk is quite low based on the facts today. He noted that he has lived through periods of stagflation when unemployment approached 10%, earnings were imploding and GDP growth was handsomely negative. He contrasted that to today’s conditions of inflation slowing from 9% to below 3% on an annualized basis, earnings growth approaching double digits, unemployment of only 3.8% and a current annual run rate in GDP of 2% to 3%. Powell said, “Frankly, I don’t see the ‘stag-’ or the ‘-flation’” in the data.
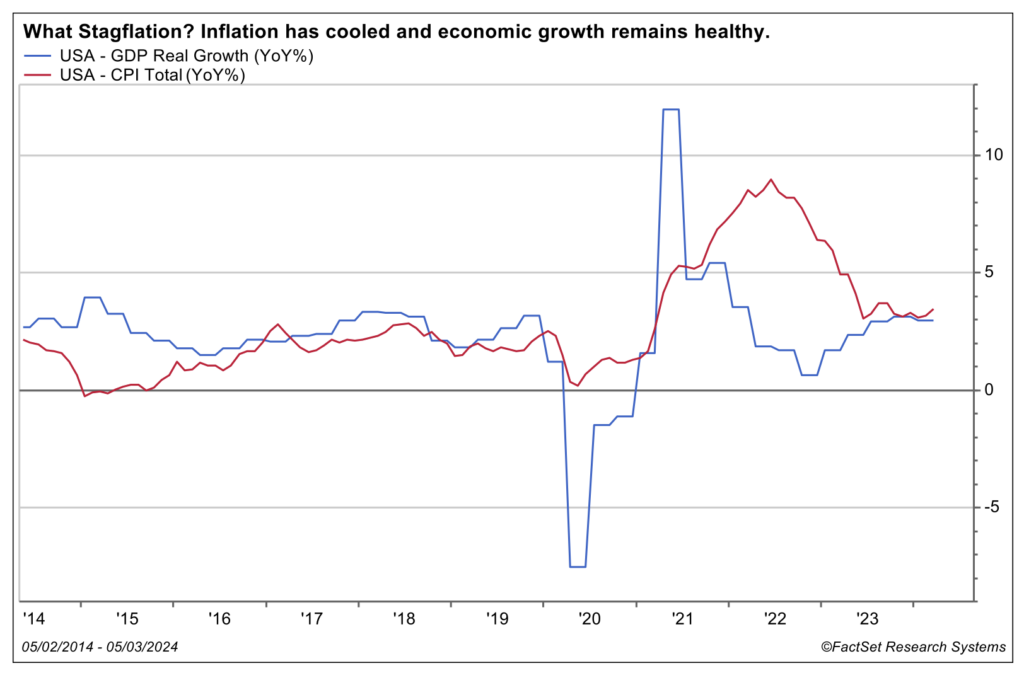
Source: FactSet
This reminded me of economist Thomas Sowell’s longstanding distaste for mythical commentary that can be spread as evidence-based and fact—hence, the quote at the beginning of this commentary. Sowell observes that simple repetition of falsehoods can make them become accepted as truths. I’ve seen this happen with other distorted assertions such as: 1. Every inverted yield curve unquestionably leads to recession; 2. Growthy technology stocks can’t do well in a rising interest rate environment like 2023; 3. The U.S. stock market performs horribly in the May to October time period (“Sell in May and Go Away” adage); and 4. Only the Magnificent 7 are performing well in this bull market.
Really? Check the facts. Not! Good analysis comes from disciplined research and building a mosaic of confirming data. All these tools and theses cannot be viewed in isolation. They need to be examined closely and put in proper context when drawing conclusions.
Wrap-Up
We remain positive but measured in market direction based on the facts and solidly in “hold your ground” mode. At the individual stock level, the internal equity team appreciates the lower correlation between stocks and the increasing evidence that more are zigging while others zag. This creates opportunity to add value in specific stock selection and active management versus a purely passive index approach.
Sources:
1-4,FactSet
5J.P Morgan Guide to the Markets-Asia
6St. Louis Federal Reserve
7Federal Reserve Board
This commentary is provided for informational and educational purposes only. It is not intended to be personalized advice or a recommendation to buy or sell any security or engage in a particular investment or other strategy. Nothing herein should be relied upon as such, and there is no guarantee that any claims made will come to pass. Actual results or developments may differ materially from those projected. The information is deemed reliable, but we do not guarantee accuracy, timeliness, or completeness. It is provided “as is” without any express or implied warranties. Any opinions expressed are subject to change without notice and are not intended as investment advice or to predict future performance.
Investing involves risk and the potential to lose principal. Past performance does not guarantee future results. Please consult your financial professional before making any investment or financial decisions.
The indexes referenced herein are unmanaged and cannot be directly invested in. The S&P 500 Index is a market-cap weighted stock index constructed to track the share price performance of the top 500 large-cap U.S. equities.
Mariner is the marketing name for the financial services businesses of Mariner Wealth Advisors, LLC and its subsidiaries. Investment advisory services are provided through the brands Mariner Wealth, Mariner Independent, Mariner Institutional, Mariner Ultra, and Mariner Workplace, each of which is a business name of the registered investment advisory entities of Mariner. For additional information about each of the registered investment advisory entities of Mariner, including fees and services, please contact Mariner or refer to each entity’s Form ADV Part 2A, which is available on the Investment Adviser Public Disclosure website. Registration of an investment adviser does not imply a certain level of skill or training.