
Déjà vu on Track

If there are two economic measures which reflect economic macro-trends better than others, they have to be GDP growth and inflation. These two economic measures contain data which drives job creation, the cost of living, interest rates and corporate profits. GDP growth rates and inflation are the two variables I forecast annually and have for more than 20 years. They reflect the grist of the economy and are significant drivers of returns in the capital markets.
We’ve labeled our “core” economic theme for 2026 “Déjà vu”—we wish to conjure up in your mind’s eye a vision which you have seen before, but don’t know exactly when and where. We all experience déjà vu at times. We think that feeling may encapsulate our expectation of an acceleration in nominal GDP growth this year, as compared to last year and compared to the last 25-years average nominal GDP growth rate.
We’ve been suggesting that nominal GDP growth rate this year could be around 6.0%. Note the nominal portion of this indicator, which includes real GDP growth and inflation pressure. We’ve broken those measures down, as we expect to see real GDP growth this year of 2.5% to 3.0% and inflation to remain sticky at around 3.0%. Add both indicators together and we come up with “nominal” GDP coming in around 6.0%. Last year, economic nominal growth was 5.0%.1
Now, according to the Bureau of Economic Analysis (BEA), nominal GDP growth has averaged 4.6% from 2000 to 2025. So, we’re calling for a stronger-than-normal nominal GDP growth rate this year. Regarding déjà vu, this suggests that we’ve seen this level of growth in the past, but we’ve come through a long period when nominal GDP growth was, on balance, lower than 6.0%.
Let’s get an update on our view—and see what has been happening to GDP growth and inflation so far this year.
Chairman Warsh and inflation: An update
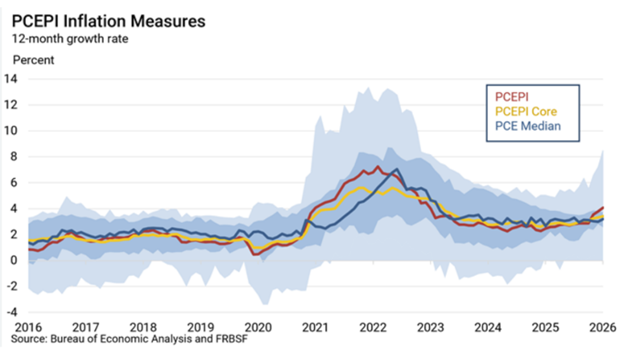
Two widely used measures of inflation are the Consumer Price Index, including both core and headline CPI, and the PCE price index, as reported by the BEA. The chart below is from the San Francisco Fed, which shows the PCE data along with dispersion data from the BEA database. This chart is useful because it shows if inflation is being primarily driven by one factor or if the rate more broad-based. As shown, we’re currently seeing a broadening in the dispersion of data, which leads to other questions. More on this later.
Source: Bureau of Economic Analysis and FRBSF
So how does the Fed measure and use inflation data? Well, we all know the Fed’s preference has been to use the BEA’s Core PCE deflator index as their go-to inflation rate. There are reasons behind this preference; for example, health care insurance costs aren’t included in the CPI data, while that important data stream is picked up by the PCE. CPI measures prices of a market-basket of consumer goods while the PCE measures prices what people spend money on.
Chairman Warsh, the new Fed chair, doesn’t rely solely on the PCED inflation rate which has been the favored inflation gauge of previous FOMC boards. Recently, Warsh has been talking about underlying inflation—Warsh seems to prefer to look at the underlying variables which feed into the final inflation data, rather than the inflation data itself. He wants to dig down deeper to more fully understand the reasons behind a change in inflation, hoping to uncover the sustainability of inflation pressure.
During his first semi-annual testimony to the Senate Banking Committee, Warsh stated that inflation occurs when a one-time change in prices broadens out and may need to be addressed through monetary policy. That’s why I included the chart above—inflationary pressures have recently appeared to be broadening. This is not a good sign as far as Warsh is concerned.
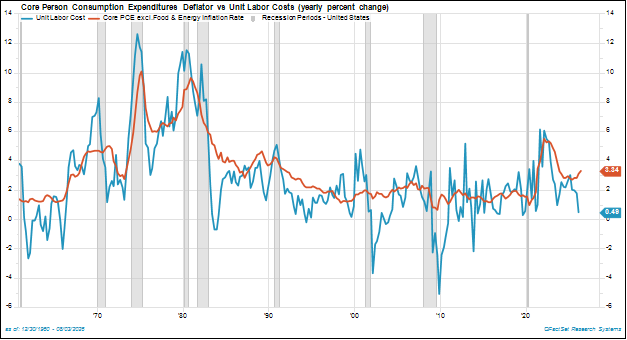
Historically, however, inflation durability tends to rise when gains in wage rates start to accelerate along with inflation, creating a wage-price spiral. Note the chart below which shows that unit labor costs (blue line) increased by a mere 0.5% on an annualized basis as of the end of Q1 this year. By this measure, the current upward push in inflation may not be sustained.
Source: FactSet Research Systems
Underlying inflation
Warsh seems to believe that underlying inflation is more important to measure and understand than a particular inflation report. So, what measure best captures underlying inflation? We don’t know how Chairman Warsh would answer this question—one of his appointed task forces will likely provide that information going forward.
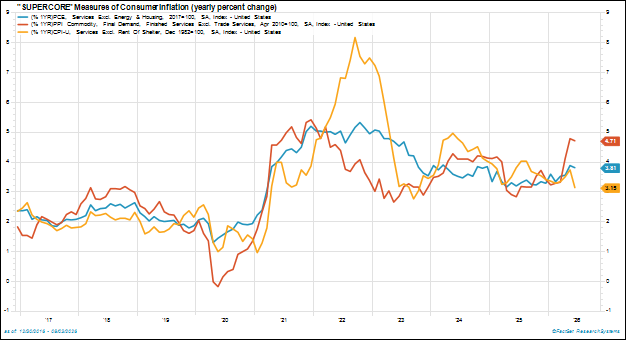
In the meantime, let’s take an “inside baseball” viewpoint of inflation trends by utilizing various measures. One inflation measure is labeled Supercore inflation; what is Supercore inflation? Price shocks tend to originate in goods prices, and not services, which represents a larger portion of consumer’s wallet than goods. If Supercore inflation rates rise and stay high, it may indicate that a goods price shock—such as rising gasoline prices—is becoming embedded in a sustained inflation pattern. This is not a good sign.
Source: FactSet Research Systems
Supercore inflation pressures are centered in prices of labor-intense services, which is more highly correlated with wage growth than goods prices. Since these prices are more tied to labor costs, the probability of a wage-price spiral initiation is intensified when Supercore inflation remains sticky. Many believe this measure offers one of the best indicators of underlying, building inflation.
As noted in the chart above, the three measures of Supercore inflation have remained elevated over the last year or so. Importantly, the PPI-based measure, shown by the red line, has been rising fairly rapidly (producer prices can front-run consumer pricing pressures).
We’ve seen two pieces of evidence that underlying inflation pressures (broadening of inflation pressures and a sticky Supercore read), which suggests the FOMC may very well raise rates by the end of the year. On the other hand (one of an economist’s favorite phrases), we see that unit labor costs remain tame.
Time will tell, of course. But this is the juggling job Warsh and the Fed is currently facing. A mixed bag, indeed. But from what Chairman Warsh has publicly stated so far, we can surmise that he doesn’t rely solely on the PCED inflation rate, which has been the preferred inflation gauge the Fed has been using. We also know he pays attention to underlying inflation rather than the finished number, as this level of questioning leads to a deeper understanding of the sustainability of an inflation shock.
We stand by our Déjà vu expectation of 3% inflation this year.
GDP growth – Don’t be deceived
Getting back to the beginning, I noted that the two economic factors I pay attention to each year are inflation trends and GDP growth rates. I’ve covered an update on inflation pressures; now let’s briefly cover some recent thoughts on GDP growth.
Per my long-standing core economic theme this year, I’m looking for an acceleration in GDP growth to the 2.5% to 3.0% range. Last year real GDP growth came in at 2.1%, which was just below what has been the longer-term (2000-2025) average real GDP growth of 2.2%.1 I’ve been suggesting that the impact from the One Big Beautiful Bill Act (OBBBA) tax package and the upward push in capital spending will lead to an acceleration in real GDP growth this year as compared to the historical norm.
How are we doing so far this year? First quarter GDP growth came in at 2.1%. First release of second quarter GPD came in lower at 1.5%.1
I’m suggesting that folks shouldn’t be alarmed by this reduction. Why? According to the Atlanta Fed, a poor reading in the Advance Economic Indicator data took a full 1.3% growth away from the second quarter report. So, what is the Advance Economic Indicator data and why should we pay little attention to this measure?
The AEI, which is calculated and reported by the Census Bureau, came in at -4.1% for June. The indicator measures import/export (trade) and wholesale/retail trade activity. Recently, the trade balance has ballooned upwards as export growth has slowed and imports have risen, lowering the official GDP growth rate.
The AEI report suggests that recent U.S. economic growth may have accelerated relative to the rest of the world, and has little to do with raw, domestic final demand growth. This means that imports grew (due to rising demand to satisfy U.S. growth needs) and/or exports declined (due to declining final demand from economies outside the U.S.).
Also, the report’s inventory data shows inventories are building at both the wholesale and retail levels. This can happen for a number of reasons, but I suggest one reasonable explanation has to do with tariff activity and the pandemic supply chain disruption which has led to businesses carrying higher sustained levels of inventory. So, while the AEI decline is important to monitor, I haven’t changed my expectation of an underlying economic growth rate to prevail in 2026.
I’m not surprised to see an initial reported slowdown in second quarter GDP growth.
Jobs Market Update
So, away from the theoretical and back to the real world.
Some economic data we see is labeled high frequency data, meaning that it’s data which is released often and measures short periods of economic activity. One such report occurs every Thursday as the Bureau of Labor Statistics (BLS) reports on the nation’s initial unemployment claims data for the previous week—those who were laid off from their jobs over the previous week. The report of new claims released on 7/23/26 was 187,000 people. This is a stunningly low number.
The last time we saw initial unemployment claims lower than this was in May of 1969, when the total employment base was 70.3 million workers. Today, the total labor force is 169 million.2 So, the ratio of the total labor force to initially unemployed is 0.11%. This suggests employers are hesitant to let workers go, which is a good thing if you have a job but may also reflect the reality that if you are unemployed, getting a job is difficult.
We stand by our expectation that real GDP growth will run at a 2.5% to 3.0% range this year.
Kevin Warsh in the dock
I think the appointment of Kevin Warsh as Fed chair is a fascinating event. He promises to be a different Fed chair than we have seen recently. Those in the know suggest his actions and methods may remind us of the two greatest chairs of recent years: Volker and Greenspan. At the least, I suspect Warsh will show his hawkish tendencies if inflation rises. He won’t tolerate it long.
We stand by our Déjà vu economic call.
Final word – Fun numbers
Finally, studying economics doesn’t always have to be boring. At times, economists like to have fun as well. According to a recent Barron’s Magazine:
- 29: The number of days this year that the 30-year Treasury bond has traded above 5%, the most since 2007.
- 1,000+: The number of Americans with at least $25 million in their IRAs in 2024, more than double the number in 2019. Sign of a bull market.
- 7.3%: The one-year decline in the median listing price for a single-family home in wildfire-scarred Malibu, CA.
Sources:
- Source: Bureau of Economic Analysis
- Source: US Bureau of Labor Statistics
This commentary is provided for informational and educational purposes only. As such, the information contained herein is not intended and should not be construed as individualized advice or recommendation of any kind.
The opinions and forward-looking statements expressed herein are as of the date of publication, are based on current assumptions and market conditions, are subject to change without notice, and actual results may differ materially from those expressed or implied. The information provided herein is believed to be reliable, but we do not guarantee accuracy, timeliness, or completeness. It is provided “as is” without any express or implied warranties.
There is no assurance that any investment, plan, or strategy will be successful. Investing involves risk, including the possible loss of principal. Past performance does not guarantee future results, and nothing herein should be interpreted as an indication of future performance. Please consult your financial professional before making any investment or financial decisions.
Mariner is the marketing name for the financial services businesses of Mariner Wealth Advisors, LLC and its subsidiaries.
Investment advisory services are provided through the brands Mariner Wealth, Mariner Independent, Mariner Institutional, Mariner Ultra, and Mariner Workplace, each of which is a business name of the registered investment advisory entities of Mariner. For additional information about each of the registered investment advisory entities of Mariner, including fees and services, please contact Mariner or refer to each entity’s Form ADV Part 2A, which is available on the Investment Adviser Public Disclosure website. Registration of an investment adviser does not imply a certain level of skill or training.