
U.S. economy: Stronger than meets the eye

Chance favors the informed mind.
– Louis Pasteur
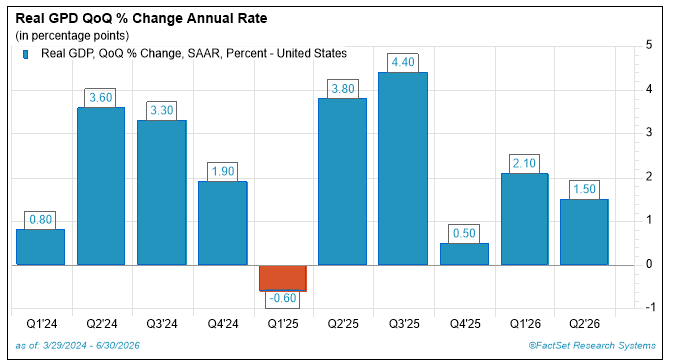
My “Déjà vu” 2026 core economic theme has been calling for “real” GDP growth to be 2.5% to 3.0% this year. So far this year (through the end of Q2), we have seen real GDP growth reported at a 1.8% annualized rate.1 Am I missing something with my view that GDP growth should be well above where economic growth has resided for the first half of the year?
GDP autopsy
As we conduct an autopsy of the first half growth this year, if we exclude government spending and trade activity and focus on the private, domestic segment of the economy (consumption and investment spending), we see the economy has grown by 2.3% on an annualized basis. This is compared to the reported 1.8% rate, which includes government and trade activity.1
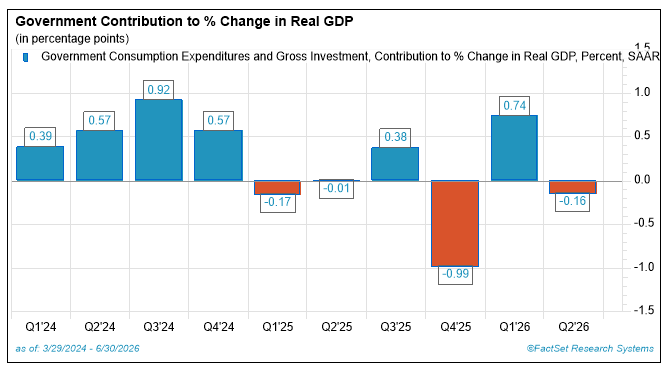
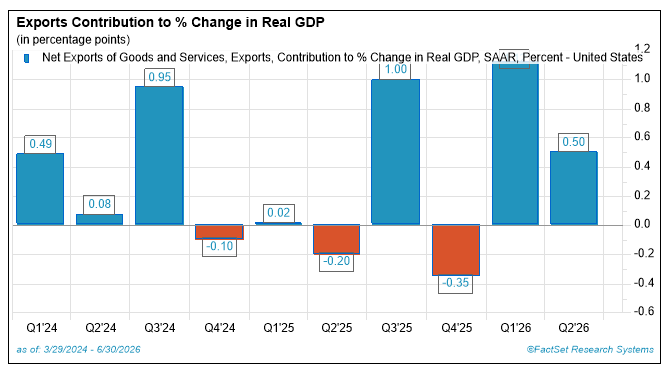
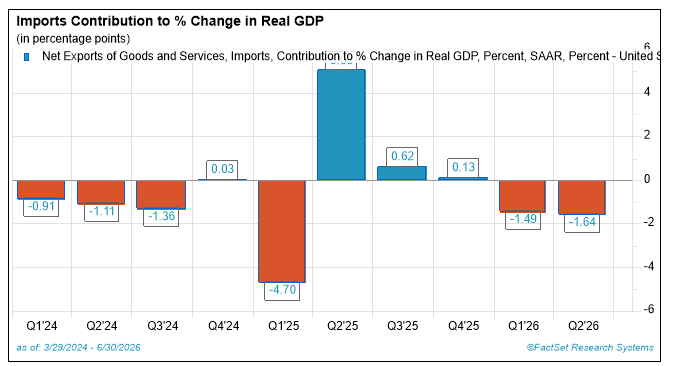
The Q2 GDP report was impacted dramatically by the government spending and trade activity reports. Including these areas, the report showed GDP growth of 1.5% for the quarter.1 Excluding these areas, the economy grew by 2.8% for the quarter, in-line with my Déjà vu concept.1 I suggest the non-government, private side of the economy is displaying stronger growth than the macro data is currently suggesting.
Source: FactSet
Policy influenced contributors to GDP
Source: FactSet
Source: FactSet
Source: FactSet
Supply/Demand market influenced contributors to GDP
Source: FactSet
Source: FactSet
Is it Fair?
Is it fair to exclude government spending and trade activity when analyzing GDP activity? One can make that argument as spending in these two areas are, of course, driven by political winds. Classifying government spending with this moniker is obvious. Now, with changing tariff rates the same can be said about trade activity, both imports and exports.
In addition to being driven by governmental winds, and not by true market-driven supply/demand factors, the results in these areas have been very volatile over the last few years. Note the charts above, which show Federal government spending and trade activity’s impact on reported GDP growth—volatile patterns, all around.
Next, let’s take a look at how consumer and investment spending have impacted GDP growth over the last few years, by quarter, which are areas that aren’t dominated by government winds.
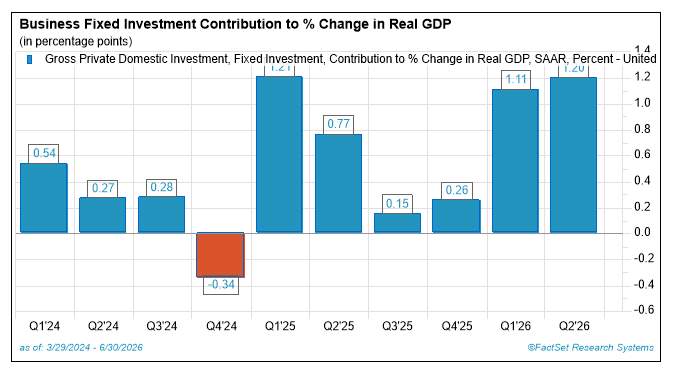
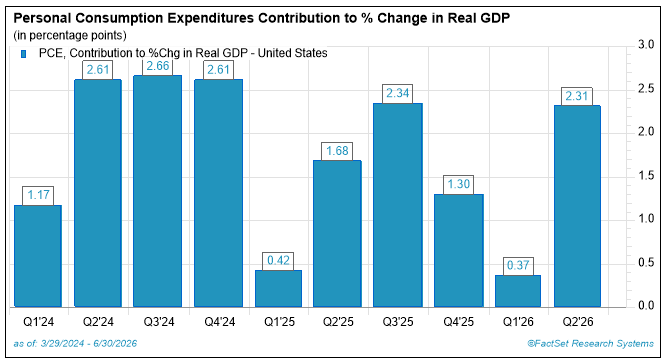
Compare those three charts with the same type of charts that outline the growth rates of consumer spending and business investment activities, and you see a distinctly different pattern. Comments on these two significant areas of economic activity follow.
Business fixed investment
Of course, the “star” driving economic growth recently is information processing equipment and software (computers and peripheral equipment), which is up a stunning roughly 60% year over year!1 This spending is part of the Business Fixed Investment (BFI) segment of the GDP growth, and we see that BFI spending increased by 1.2% in the second quarter.1 Why didn’t this area generate a larger impact on GDP growth? A big driver of BFI spending is spending on structures. New residential construction is also part of this figure.
A significant portion of business fixed investment resides in real estate development expenditures—both commercial and residential. Real residential investment and nonresidential structures investment are both down roughly 4% to 5% from a year ago through the second quarter, weighing on the broader investment picture. Even with that weakness, total business investment is still up about 3.6% for the first half of this year compared to the first half of 2025.1
Consumer Activity
We all know that irrespective of the massive artificial intelligence (AI) buildout, the U.S. economy will have difficulty showing robust growth without the consumer participating in that growth, as consumer spending represents just shy of 70% of GDP. Consumption activity for the median consumer has been constrained since the start of the Iran war earlier this year. The culprit is, of course, gasoline prices and uncertainty.
Note the chart above which shows PCE’s impact on quarterly GDP growth. Also note the oddity of growth weakness in the first quarter, each year over the last three, compared to the rest of the year. This is an oddity which I haven’t seen explained away. Most years in the past show weakness in first quarter GDP growth as compared to the rest of the year. This year the same has been occurring.
Some suggest first quarter consumer spending activity tends to be weak due to post-holiday spending fatigue, winter weather and data-gathering quirks. Irrespective of the exact reasons, we have seen weak consumer spending patterns develop during the first quarter each year, only to be followed by a strong uptick in growth rates as the year unfolds.
So far this year that pattern seems to be continuing.
Are high gasoline prices and high mortgage interest rates affecting consumption activity? Of course. But the real weight of these two factors hasn’t revealed itself fully in consumption growth rates—yet. As of the end of July, total housing starts have slowed by 13.5% as compared to a year earlier.2
Over that period of time, 30-year mortgage rates increased from 6.15% to 6.65% so far this year.3 However, building permits have increased by 3.1% over the last year.2 Perhaps we are seeing a trough forming in the housing starts business? So, increasing long-term interest rates have had an effect on the housing market.
What is weighing heavily on consumers? Don Rissmiller, the Chief Economist at Strategas writes that as a rule of thumb, if gasoline prices + 30-year mortgage rates equal “10” or more, we may expect to see constrained consumer spending growth. According to Don’s work, recent gasoline prices were at $4.18 per gallon, and mortgage rates were at 6.65%.
Don’s work shows that the combination of these two factors generally leads to a slowdown, which may not occur for up to 12 months. We’ll track these two variables as we move forward.
Jobs market at loggerheads
In addition to high gas prices and higher mortgage costs, the jobs market has been stagnant. Recently, I wrote at length about the lack of new jobs as the economy has been generating about 30,000 new jobs per month for the last 12 months. By many estimates, that level of job creation is representative of the jobs market treading water. Fortunately, the number of job firings has been extremely light. So, job creation on a net basis has been stagnant.
It seems to me that the stagnant jobs market may be a result of many businesses questioning their use of AI technology developments and how, over the long-term, the application of AI will affect their need and use for employees. Stay tuned on this issue as it is still developing.
Consumer sentiment read
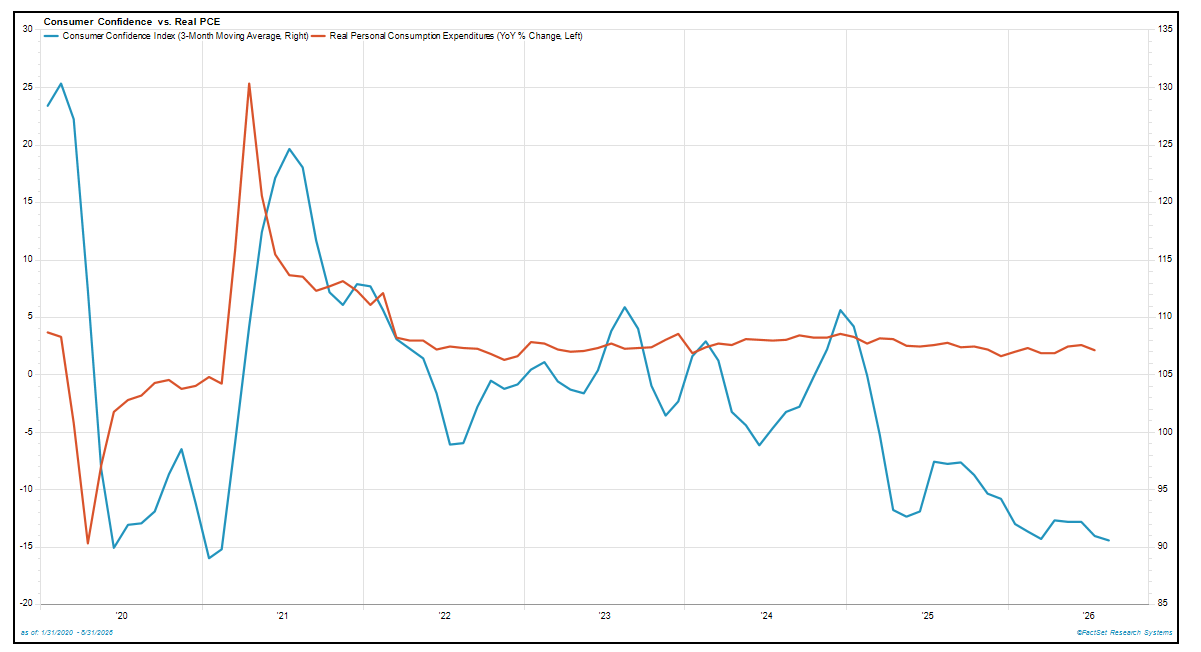
What of consumer sentiment, which is a decent measure of the “willingness” for consumers to spend? The chart below is a good representation of current and historical consumer confidence levels (blue line) overlaid on Personal Consumption Expenditure (PCE) levels. Note the spread where confidence is now much lower than spending levels would indicate.
These two data series started to deviate from each other about a year ago. I have long said that for a transaction of any kind to take place, the ability and willingness to transact is necessary. It seems consumer’s willingness to transact is starting to show some strain. This is another relationship which needs further monitoring.
Source: FactSet
Déjà vu still in play
At the beginning of this year, I assumed that the increased tax refunds which the One Big Beautiful Bill Act (OBBBA) brought forward would lift GDP growth by about 0.25% this year. For all purposes, those increased tax refunds and the increase in consumer spending those refunds could bring to the table are now in the rearview mirror. They were partially eaten up by the increase in gasoline prices brought about by the Iranian war. Gasoline prices are about 30% higher this year than last.
Of course, my Déjà vu economic theme didn’t forecast the start of a Middle East war, nor the increase in headline inflation pressure. Consumer’s savings rates have fallen along with the increase in general living costs.
In the face of all this, consumer retail sales growth remains resilient. Retail sales excluding autos and auto parts were up 0.3% for the month in July (nominal rate). The increase in July retail sales was led by vehicles, which rose 1.6%. All-in-all, however, our measures of discretionary retail sales and their core each rose 0.5%, only a modest deceleration from the prior month, which suggests that consumers still have the budget and willingness to spend.
Final word
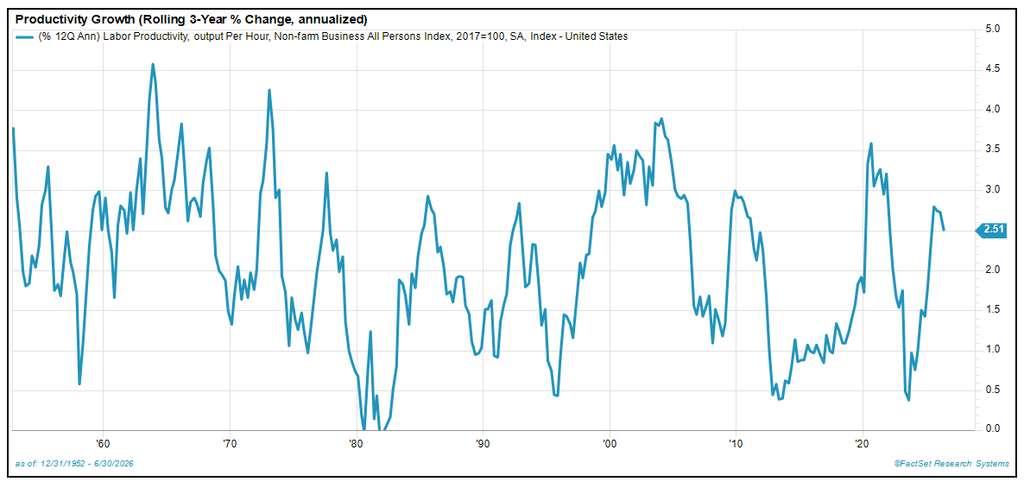
I can’t wind up this update on the Déjà vu concept without looking at worker productivity growth rates. According to Ned Davis Research (NDR), high tech and R&D spending ran at 2% to 3% in the 1960’s through the 1970’s. This spending rate peaked coming into the end of the 1990s at a little over 6% of GDP, which spurred worker productivity upwards to the 3%+ range.
That surge in tech spending collapsed in the 2007-2008 recession, ushering in a decline in worker productivity growth (note chart below).
Source: FactSet
Currently, tech spending is above 7% of GDP, and worker productivity is back on the rise (NDR).
I have long said that worker productivity growth is the mother’s milk of societal wealth creation. Note the chart above which shows that worker productivity has been rising nicely. At 7% of GDP, with the past reflective of the future, we may see growth in worker productivity reach the 3% range.
Jobs growth is important, of course. But if worker productivity rises to 3% annual growth rates, we may see the economy growing nicely without the need to create a tremendous number of new jobs.
Déjà vu—an environing of 6% nominal GDP growth—is still our core call for 2026.
Sources:
- Source: Data sourced from the Bureau of Economic Analysis.
- Source: Data sourced from the U.S. Census Bureau.
- Source: Freddie Mac https://www.freddiemac.com/pmms
This commentary is provided for informational and educational purposes only. As such, the information contained herein is not intended and should not be construed as individualized advice or recommendation of any kind.
The opinions and forward-looking statements expressed herein are as of the date of publication, are based on current assumptions and market conditions, are subject to change without notice, and actual results may differ materially from those expressed or implied. The information provided herein is believed to be reliable, but we do not guarantee accuracy, timeliness, or completeness. It is provided “as is” without any express or implied warranties.
There is no assurance that any investment, plan, or strategy will be successful. Investing involves risk, including the possible loss of principal. Past performance does not guarantee future results, and nothing herein should be interpreted as an indication of future performance. Please consult your financial professional before making any investment or financial decisions.
Mariner is the marketing name for the financial services businesses of Mariner Wealth Advisors, LLC and its subsidiaries.
Investment advisory services are provided through the brands Mariner Wealth, Mariner Independent, Mariner Institutional, Mariner Ultra, and Mariner Workplace, each of which is a business name of the registered investment advisory entities of Mariner. For additional information about each of the registered investment advisory entities of Mariner, including fees and services, please contact Mariner or refer to each entity’s Form ADV Part 2A, which is available on the Investment Adviser Public Disclosure website. Registration of an investment adviser does not imply a certain level of skill or training.