
Economic Boom

“Never invest in a business you cannot understand.”
– Warren Buffett
The quote above comes to us from the just-retired ‘Oracle of Omaha’. There is only one Warren Buffett. He will be missed on the national scene.
At the most recent FOMC meeting, the Fed raised the federal funds rate to 3.75% – 4.00%. This was one of the most broadly expected rate increases that we have seen for quite some time. Both the stock and bond markets yawned and moved forward.
The Fed is famous for taking the economic punchbowl away when the party really starts to cook. Our core economic call this year—déjà vu—has been centered on an acceleration in both “real” economic growth and inflation, leading to a strong upward move in “nominal” GDP growth. We have been calling for 6% nominal GDP growth this year as compared to the long-term (1990-2025) average of 4.8%. It appears the “boom” phase of the business cycle has arrived.
We are calling for 6% nominal GDP growth this year and so far, we haven’t been disappointed. Along with 3% “real” GDP growth, we expect inflation rates to remain “sticky” at 3%+ this year. Overall, our déjà vu theme seems to be playing out.
To answer the question above—why 6% nominal GDP growth rate is a big deal—this growth level has been rather rare over the last few decades. Since 1990, we have seen nine years when nominal growth exceeded the 6% hurdle. So, over the last 35-year period, this level of “hot” growth has only happened about 25% of the time. Déjà vu, indeed—something you recognize but haven’t seen for a while.
For investors and businesses alike, the big implications of this level of growth are its impact on corporate earnings and interest rates.
S&P 500 Earnings Boom Years — Market & Treasury Performance
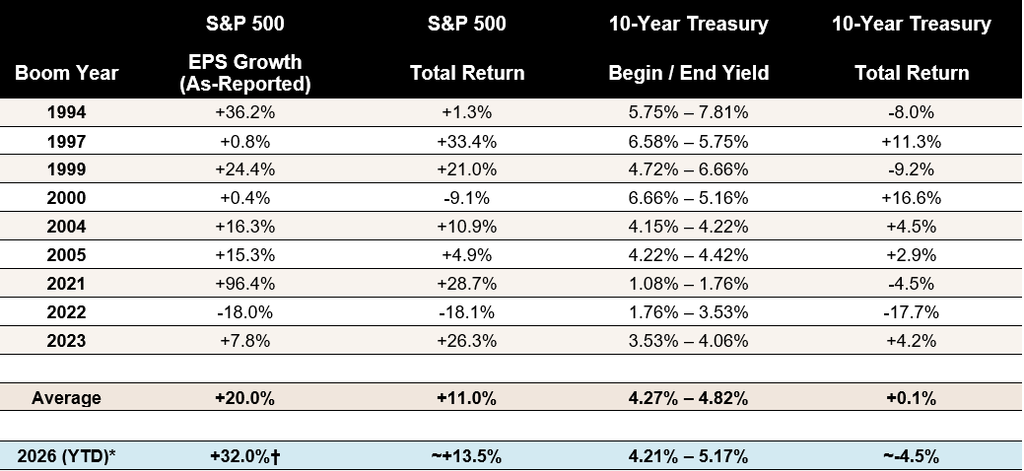
* 2026 YTD data as of approximately September 26, 2026. Not a full-year figure.
† 2026 EPS Growth: FactSet CY 2026 bottom-up consensus operating EPS growth estimate as of September 2026 (+32.0%). Refinitiv/LSEG consensus (as-reported GAAP) as of September 11, 2026 implies +34.1% ($363.71 vs $271.29). Note: 2026 GAAP EPS is significantly elevated by one-time unrealized investment gains at Alphabet (+$98B) and Amazon (+$53B in Q2); JPMorgan estimates normalized GAAP growth at ~+28% excluding private-company revaluations.
S&P 500 Total Return: Includes dividends reinvested. Source: S&P Dow Jones Indices / Damodaran (NYU Stern).
10-Year Treasury Yields: Year-end constant-maturity yields. Source: US Treasury / Federal Reserve H.15 release.
10-Year Total Return: Approximate annual total return on 10-year US Treasuries.
Download official S&P EPS data: spglobal.com/spdji/en/documents/additional-material/sp-500-eps-est.xlsx
Source: S&P Dow Jones Indices (as-reported GAAP EPS); S&P DJI / Damodaran (total returns); US Treasury / Federal Reserve H.15 (yields)
The data contained in the table above is historically instructive.
- During previous economic growth “boom” phases, corporate earnings have grown at an average rate of 20%, far above the long-term average of 9%.
- The total return of the S&P 500 index was 11.0%, in line with historical norms.
- The conclusion is that during these periods, the P/E ratio of the index has declined rather dramatically, as price appreciation has been significantly less than earnings growth. So far, this trend has been confirmed in 2026. In other words, strong growth can cover up a lot of valuation sins.
- It is somewhat surprising that longer-term interest rates, on average, haven’t risen dramatically during these previous “boom” growth phases. That trend hasn’t held this year, as the 10-year Treasury yield has increased by almost 80 bps since the beginning of the year.
For many investors, the capital market reactions during our current déjà vu period have tended to rhyme with previous periods of higher-than-normal “nominal” growth. As a result, market-based valuation levels are now more reasonable than they were at this time last year.
Federal Reserve’s tightening move
The federal funds rate increase has occurred. As I noted earlier, when the Fed initiated new tightening moves in the past, those moves typically included multiple federal funds rate increases. The Fed has raised rates only once before—what we would call a “one and done” move—in 1997. My measurement work starts at the initial increase and ends at the eventual, initial decrease.
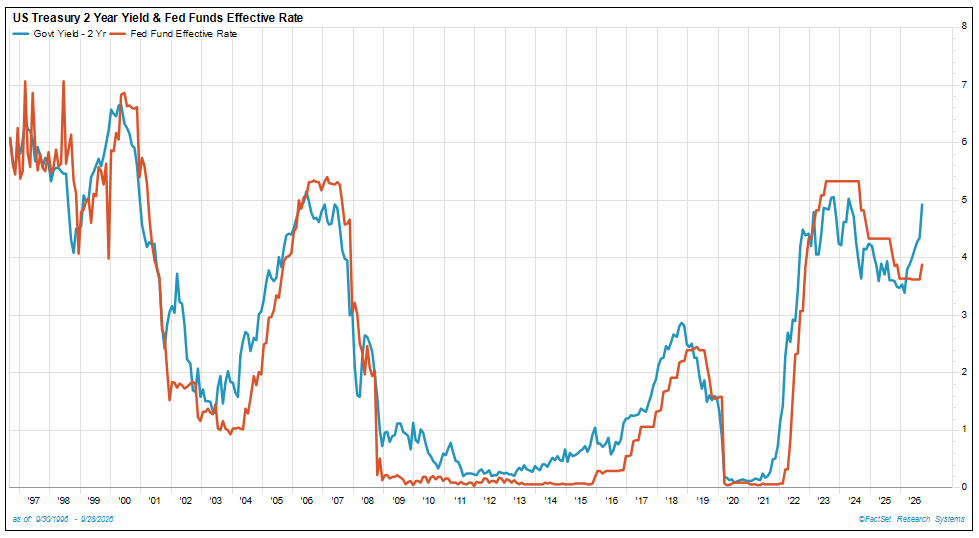
Many are expecting the Fed to raise rates again later this year. We will see. I recently read a piece in Barron’s that compared the federal funds rate to the two-year Treasury note yield. As the chart shows below, there has historically been a reasonably tight relationship between the federal funds rate and the two-year Treasury yield.
Source: FactSet
Currently, the federal funds rate is 3.88%, and the two-year note is yielding 4.92%, creating an unusually wide yield spread of 1.04%. If this relationship holds, the federal funds rate may have “room” to increase by another four 0.25% moves. This would suggest the Fed is “behind the curve” even after the recent rate increase. But of course, that is all speculation. The two-year Treasury yield could just as easily come back down by 100 basis points. Either way, the spread suggests the two-year Treasury yield is relatively attractive compared with the current federal funds rate.
Boom quarter
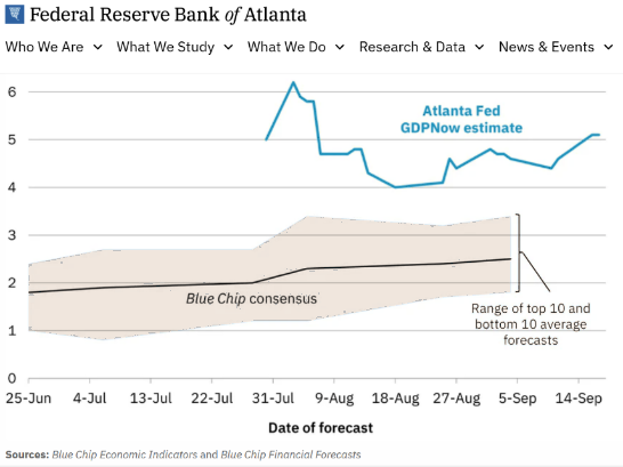
Let’s shift our focus back to economic growth. According to data from the Atlanta Fed, the economy is currently experiencing a growth boom. Their “GDP Now” model suggests that if the 3rd quarter were to end today, the BEA would report that the economy grew by 5.1% on an annualized, “real” basis (see chart below). If this happens, the “real” annualized growth rate for the first 3 quarters of 2026 would come in at 2.9%, in line with our déjà vu thematic work.
Source: Blue Chip Economic Indicators and Blue Chip Financial Forecasts
The average annualized quarterly growth rate in the U.S. since 1990 has been 2.5%. Out of the 146 quarterly GDP reports we’ve seen in that time, only 15 have exceeded a 5.1% “real” annualized growth rate.1 So if the Atlanta Fed’s “GDP Now” report holds, the current quarter will rank in the top decile of quarterly GDP reports released over the last 35 years.
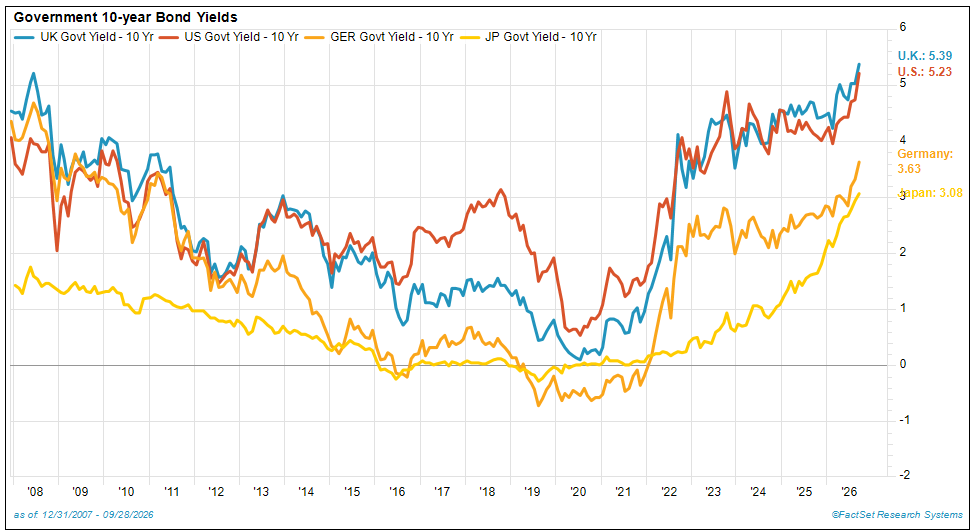
The projected growth surge isn’t just occurring in the U.S. Stronger global growth, along with higher inflation pressures, is prompting major central banks to raise short-term interest rates. Both the ECB and the BOJ, for example, have recently increased rates.
Source: FactSet
This monetary policy tightening is leading to higher long-term as well as short-term interest rates. For the time being, global economic growth remains reasonably stout, even in the face of higher borrowing costs. Note the chart above, showing yields on various countries’ 10-year government bonds, which all bottomed out in 2020-2021. At that time, these yields were below 1% and now range from 3% in Japan and more than 5% in the U.K. Cost-of-capital risks are rising across the yield curve.
Productivity helping
A key factor in the economy’s ability to withstand higher interest costs is the surge in worker productivity. As noted in the chart below, BLS data shows that labor productivity has averaged +2.1% over the last five years, above the 1.5% annualized rate of the prior business cycle and in line with the long-term rate shown in the BLS data.2 As workers become more productive, employers can pay higher wages without negatively impacting profit margins. But has this been happening on a broad scale? No.
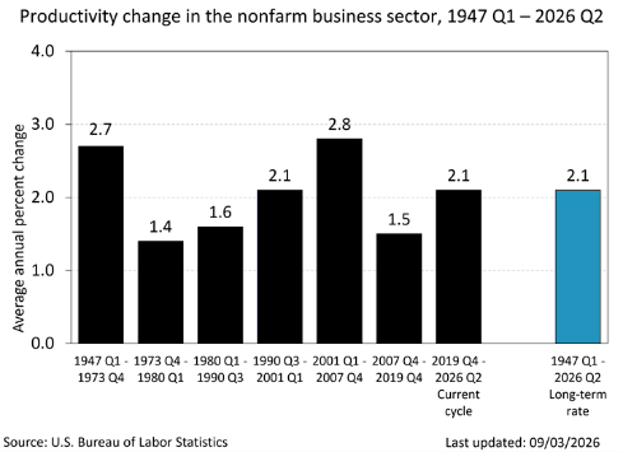
Source: U.S. Bureau of Labor Statistics
Household income losing share
Labor’s share of economic output, meaning wages and benefits, has fallen to the lowest level we have seen since the end of WWII. It now stands at 52.8%, down from over 65% (see chart below).
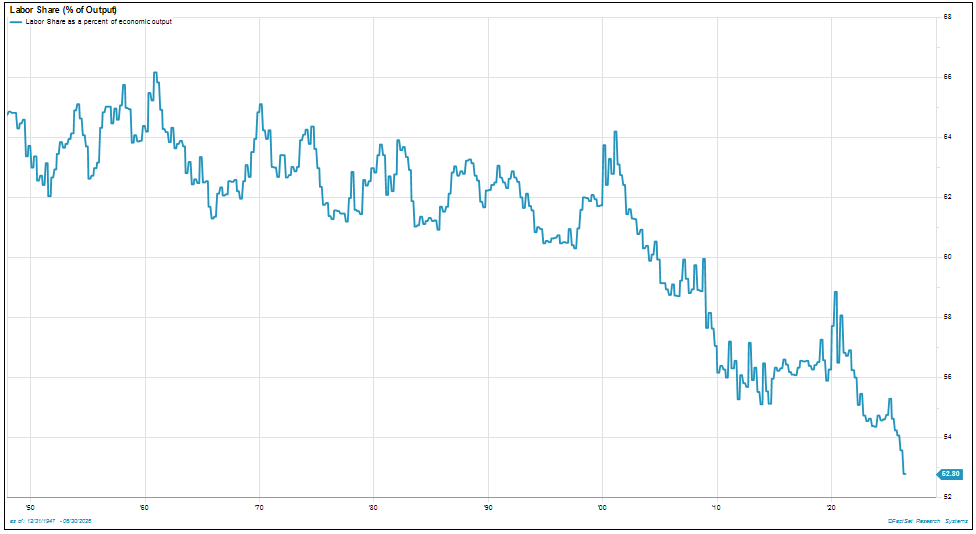
Source: FactSet
Young workers are having a hard time meeting their bills or affording a home. Now you know why workers in the U.S. feel underpaid as compared to previous generations. In comparison to total economic output, they are. The decline in labor’s share provides important context for these concerns. The bigger question is what this shift in income distribution means for households, businesses and the broader economy.
Sources:
1. Bureau of Economic Analysis
2. Bureau of Labor Statistics
This commentary is provided for informational and educational purposes only. As such, the information contained herein is not intended and should not be construed as individualized advice or recommendation of any kind.
The opinions and forward-looking statements expressed herein are as of the date of publication, are based on current assumptions and market conditions, are subject to change without notice, and actual results may differ materially from those expressed or implied. The information provided herein is believed to be reliable, but we do not guarantee accuracy, timeliness, or completeness. It is provided “as is” without any express or implied warranties.
There is no assurance that any investment, plan, or strategy will be successful. Investing involves risk, including the possible loss of principal. Past performance does not guarantee future results, and nothing herein should be interpreted as an indication of future performance. Please consult your financial professional before making any investment or financial decisions.
Index performance is provided for informational and comparative purposes only. Indices are unmanaged and cannot be invested in directly. Index returns do not reflect the deduction of fees, expenses or taxes.
Mariner is the marketing name for the financial services businesses of Mariner Wealth Advisors, LLC and its subsidiaries. Investment advisory services are provided through the brands Mariner Wealth, Mariner Independent, Mariner Institutional, Mariner Ultra, and Mariner Workplace, each of which is a business name of the registered investment advisory entities of Mariner. For additional information about each of the registered investment advisory entities of Mariner, including fees and services, please contact Mariner or refer to each entity’s Form ADV Part 2A, which is available on the Investment Adviser Public Disclosure website. Registration of an investment adviser does not imply a certain level of skill or training.