
Demographics are reality/economic building blocks
Read time: 8 minutes
“The curious mind embraces science; the gifted and sensitive, the arts; the practical, business; the leftover become economists.”
– Nassim Nicholas Taleb
As we’re now deep into the fourth quarter of 2026, we’re starting to consider the probable economic environment for next year. First, we need to think about where the AI buildout goes from here. Much of the AI buildout to date, which has been instrumental in driving 2026’s “déjà vu” nominal GDP growth rate of 5.5% to 6%, was primarily funded by hyperscalers’ internal cash flow. Any growth beyond that level will incrementally drive GDP expansion. At the same time, many believe that much of next year’s new spending will be funded by the bond market.
On top of that, the Peter G. Peterson Foundation estimates that the U.S. government will borrow about $1.9 trillion from bond investors next year, in an environment of rising interest rates. Remember, the ECB, BOJ and now the Fed have all entered a new monetary tightening regime. While monetary policy is not yet “tight,” it is reasonable to expect this new central bank bias to persist as we enter the new year. Demand for capital will be high next year.
Next, we turn to the consumer, another major historical driver of GDP growth. What can we expect going forward? Let’s look at the building blocks of potential consumer activity.
We start in an environment where the jobs market seems to be “in balance.” So far this year, job creation has averaged about 68,000 jobs per month, adding approximately 0.5% to overall “real” GDP growth on an annualized basis.1 I don’t see much in the works that should displace this positive fundamental.
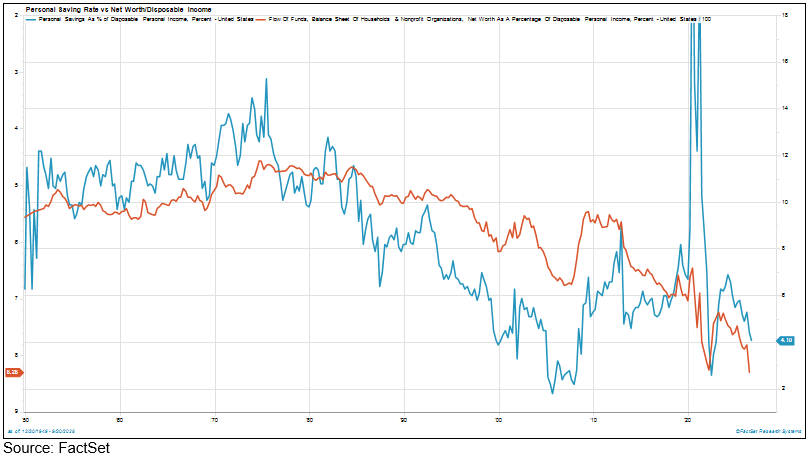
Now, what about consumer spending? In his work, Ed Yardeni highlights that the consumer savings rate has been declining. This suggests that a growing portion of consumer spending is coming from household balance sheets rather than growth in consumer income (see chart below). Ed suggests that this growing reliance on household assets, alongside declining savings rates, is itself unsustainable.
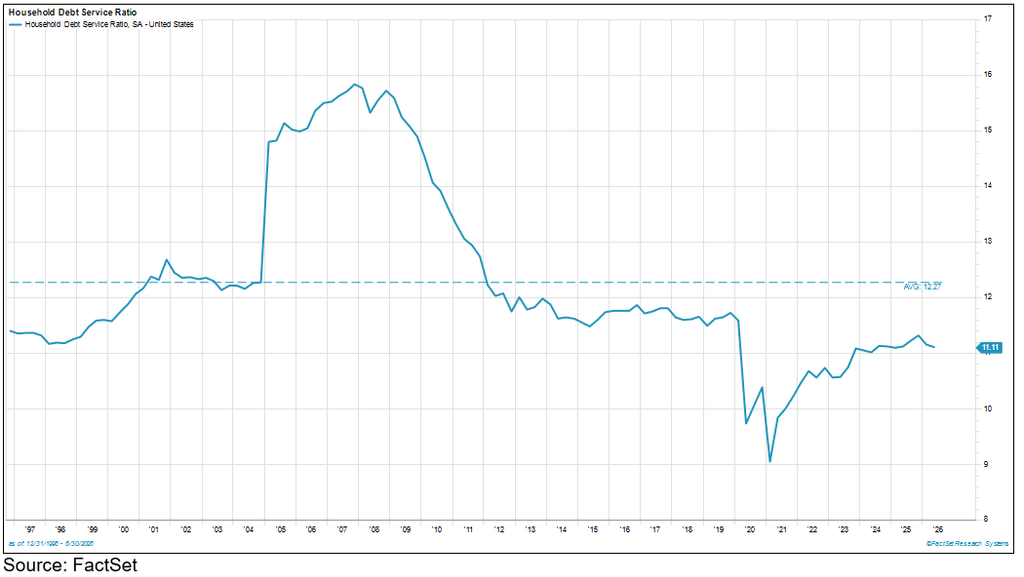
We read about the rising level of revolving credit on consumers’ balance sheet. That said, if we look at the cost of servicing outstanding consumer debt relative to consumers’ disposable income, a different picture emerges. Due to the low mortgage rates that were present a few years ago, many consumers’ debt service costs are still within historical norms (see chart below). So, it seems the consumer still has some firepower left as we head into the new year, as long as interest rates don’t spike to the upside.
The aging of the country
The old joke that economists exist to give weather forecasters credence suggests that economic forecasting is simply guesswork. Maybe. But what isn’t guesswork is data and analysis surrounding demographics. For example, if we know how many 35-year-olds live in our country today, we can reasonably estimate how many 65-year-olds will live here in 30 years. Not a lot of guesswork there.
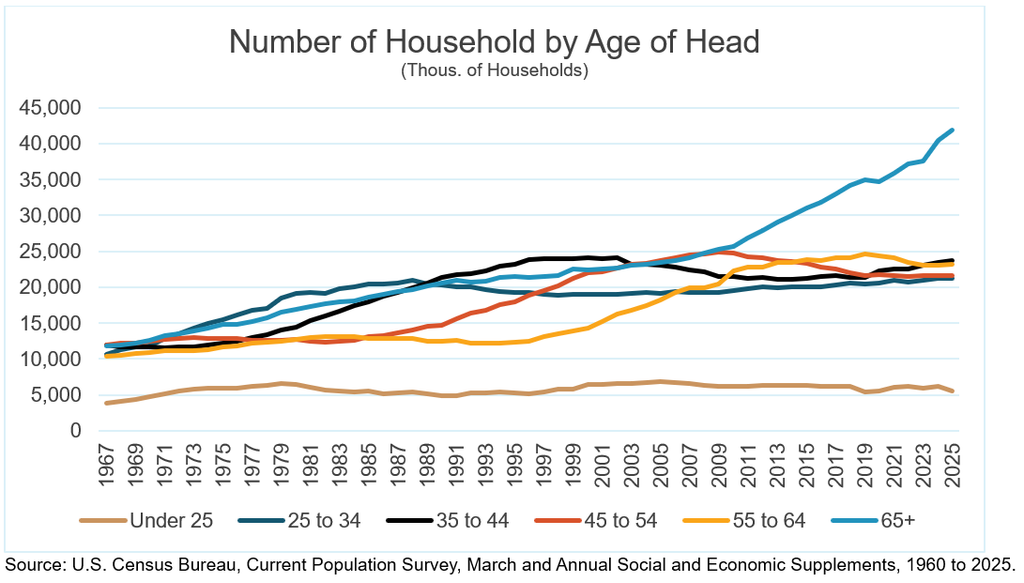
In line with this reasoning, 65-year-olds spend money differently than 35-year-olds. Therein lies the economic reasoning behind the idea that “demographics are reality.” Ed Yardeni has produced some good demographic data for us to consider when thinking about economic growth momentum. The chart above depicts U.S. households by age group.
Note that the number of households headed by someone aged 65 or older is by far the largest among the age groups, although the under-25 and 65-and-older groups cover different age spans than the other groups. The baby boomer birth rate peaked in 1957, so most members of that generation are now over the “official” retirement age. Ed points out that almost 31% of households in our country are headed by someone aged 65 or older, up from 17% in 1990.
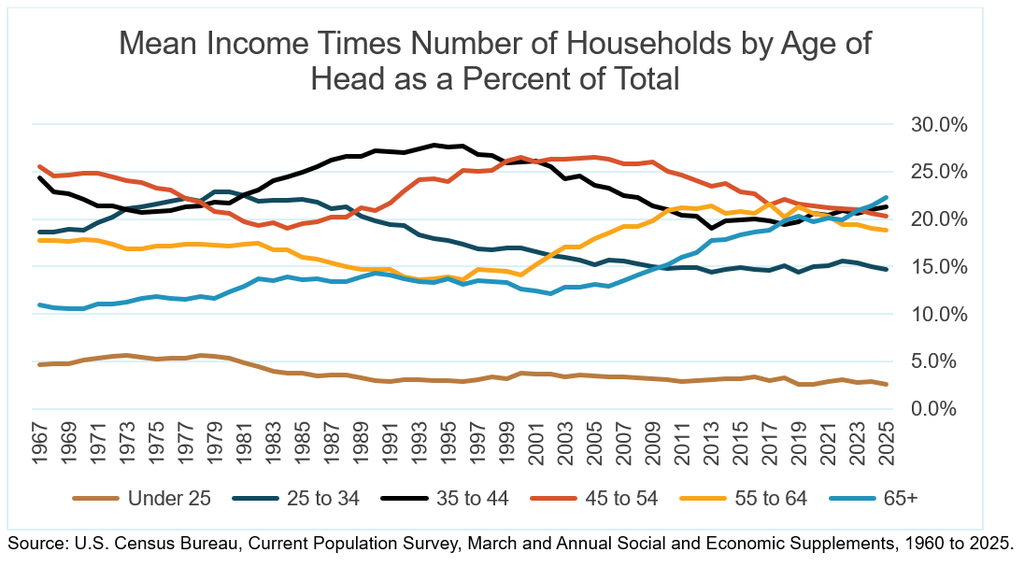
“Income life cycles” are part of the aging process. Average household income levels tend to be highest in households headed by folks 45 to 54 years old ($163,600) and tend to fall among households headed by people aged 65 and older ($92,400). Given the two data points we have uncovered — number of households by age bracket and average income by age bracket — we can calculate the consumption firepower of each age group. This data is depicted in the chart above.
As noted, the 65-and-older age group has the most purchasing power of any age bracket in the country. This is a relatively new phenomenon, as the data above shows. The chart depicts how these ratios have changed over the past 55 years. As recently as 15 years ago, the “senior” group accounted for a smaller share of aggregate household income than it does today. Now, they’re number one.
So much for the national consumer’s income statement. What about the consumer’s balance sheet? The chart below shows the combined net worth held by the Silent Generation and Baby Boomers, which make up much of the 65-and-older age group. Together, these two elder generations control a whopping $117.2 trillion in net worth as compared to $68.5 trillion for Gen X and Millennials combined (those aged 30 to 61 years old).
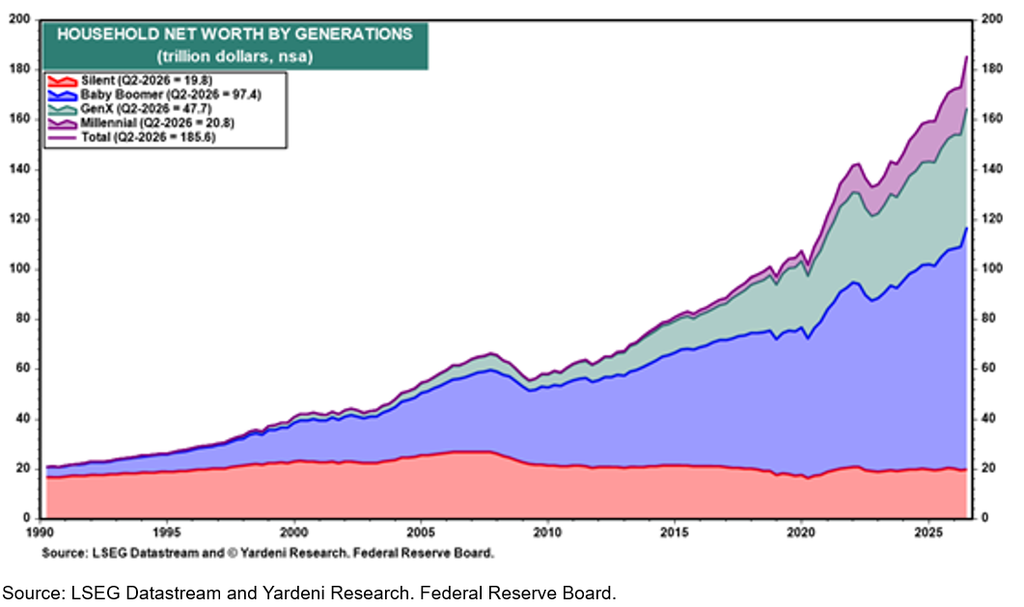
As we look at this data, it becomes apparent that the 65-and-older age bracket is a prime driver of the country’s consumer spending activity. The Silent Generation and Baby Boomers together held approximately 63% of household net worth as of the second quarter of 2026. Separately, households headed by someone aged 65 or older have the highest aggregate household income of any age group. From a macroeconomic standpoint, this leads me to the following considerations:
- As we approach the end of 2026 and the end of our déjà vu core economic theme, we start to consider the outlook for economic growth on the margin in 2027.
- The consumer represents about 67% of overall economic activity. As time has marched on and the country’s population has aged, growth in discretionary consumption has become more heavily tied to the strength of consumers’ balance sheets, along with growth in their income.
- Consequently, the older generation’s variable spending patterns tend to depend more on financial market stability than employment stability. The “wealth effect” of rising or falling asset values may weigh more heavily on this group’s discretionary spending patterns than changes in the employment picture.
- This stability may help support consumer spending and reduce the economy’s vulnerability to cyclical pressures.
- What this group spends discretionary money on also differs from the broader population. We elders like to travel and spend money on services rather than products. We already own homes, cars and other big-ticket items. Unfortunately, we also spend more on health care products and services.
- The world’s central bankers at the BOJ, ECB and now the Fed have all signaled that the prevailing monetary policy stance going forward will favor tightening moves rather than easing.
- Some suggest that central bankers tend to keep tightening monetary policy until something breaks. I don’t believe that’s always been the case, but when money supply starts to get scarce, bad things can happen to the banking system.
- Lastly, watch for stress in the bond market as both government borrowing needs and financing for the AI buildout may challenge debt market stability.
As the days of déjà vu start winding down, I expect the rapid nominal GDP growth of 5.5% to 6% to face some challenges. Results from the midterm election will help shape consumer and business attitudes and confidence, and perhaps spending as well. It’s too early to make a concrete call, but with the world’s major central bankers all moving into a tightening mode, it may be rational to expect the days of déjà vu to be numbered.
Economic growth next year, on the margin, may be more heavily driven by capital market movements. These can influence consumer spending through changes in household income and the “wealth effect” as we enter the new year.
We live in challenging times.
Sources:
- Federal Reserve Bank of Atlanta; https://www.atlantafed.org/research-and-data/publications/policy-hub-macroblog/2026/10/13/beyond-health-care-has-labor-market-improvement-broadened-in-2026
This commentary is provided for informational and educational purposes only. As such, the information contained herein is not intended and should not be construed as individualized advice or recommendation of any kind.
The opinions and forward-looking statements expressed herein are as of the date of publication, are based on current assumptions and market conditions, are subject to change without notice, and actual results may differ materially from those expressed or implied. The information provided herein is believed to be reliable, but we do not guarantee accuracy, timeliness, or completeness. It is provided “as is” without any express or implied warranties.
There is no assurance that any investment, plan, or strategy will be successful. Investing involves risk, including the possible loss of principal. Past performance does not guarantee future results, and nothing herein should be interpreted as an indication of future performance. Please consult your financial professional before making any investment or financial decisions.
Mariner is the marketing name for the financial services businesses of Mariner Wealth Advisors, LLC and its subsidiaries. Investment advisory services are provided through the brands Mariner Wealth, Mariner Independent, Mariner Institutional, Mariner Ultra, and Mariner Workplace, each of which is a business name of the registered investment advisory entities of Mariner. For additional information about each of the registered investment advisory entities of Mariner, including fees and services, please contact Mariner or refer to each entity’s Form ADV Part 2A, which is available on the Investment Adviser Public Disclosure website. Registration of an investment adviser does not imply a certain level of skill or training.