“Three yards and a cloud of dust” revisited: Déjà vu still on track for 2026

Read time: 6 minutes
We finally have our first view of last year’s fourth quarter GDP growth rates: The Bureau of Economic Analysis (BEA) recently released their preliminary fourth quarter GDP report. Economic growth slowed during the quarter as compared to the previous two quarters.
If the report stands as is (it’s up for revision), real GDP growth came in at 2.2% last year1, a touch above the estimated range we carried all year of 1.5% to 2.0%. We certainly saw a “Cloud of Dust” last year as quarterly GDP growth rates ranged from -0.6% in the first quarter to +4.4% during the year (quarterly data, annualized)—a very wide range, indeed1. More on that as we go along.
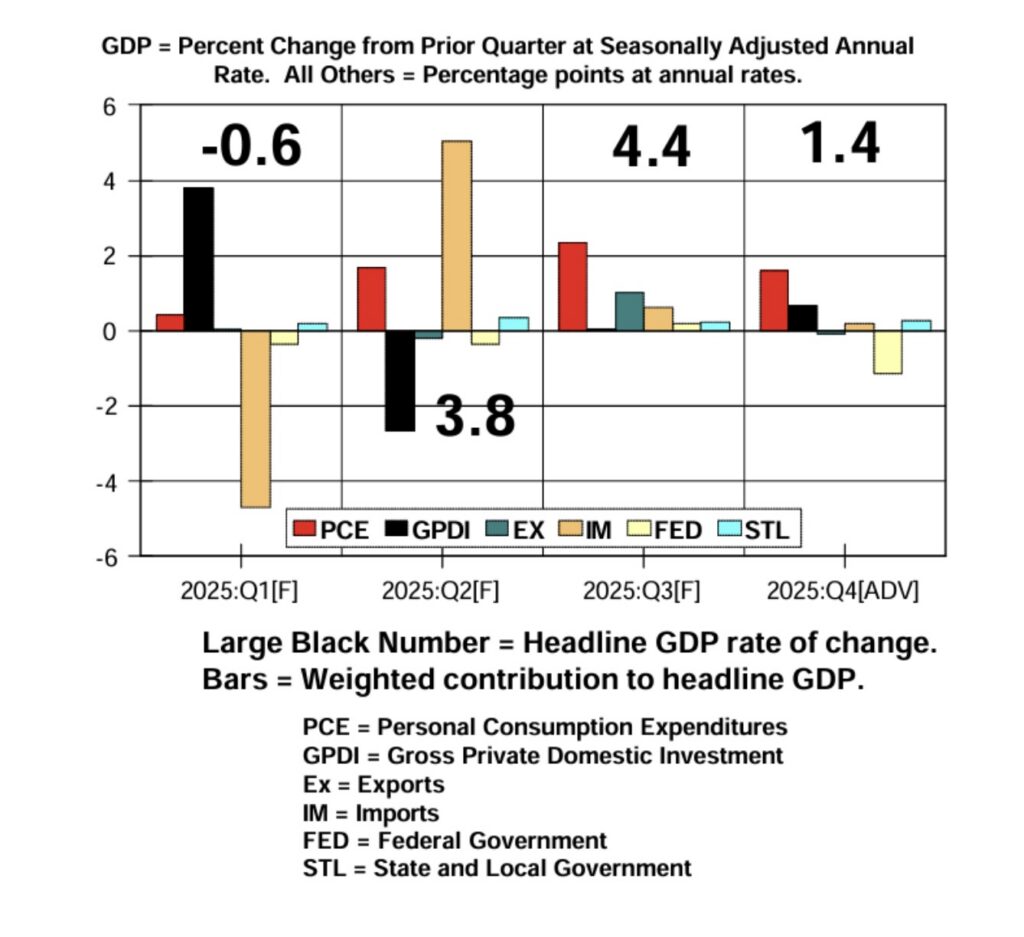
Per the chart above (provided by my long-time friend and former colleague, Dr. Bob Dieli)2, real GDP growth decelerated to a seasonally adjusted annualized rate of 1.4% during the fourth quarter of 2025, considerably weaker than the consensus expectation of 2.5%. The Atlanta Fed’s expectation of fourth quarter GDP growth was 3.0% just prior to the report’s release3. So, the report was both weaker than in the third quarter and significantly lower than consensus expectation.
As can be seen on the following table, net exports contributed less to growth for the fourth quarter than was the case earlier in the year. But the main culprit of the latest growth slowdown was the Federal government shutdown. Let’s look at the economic segment “contribution” rate to the data for the first three quarters as compared to the last quarter:
| Category | Q1–Q3 Avg. (Reported Change) | Q4 (Reported Change) | Q1–Q3 Avg. (Cont. Level) | Q4 (Cont. Level) |
|---|---|---|---|---|
| Real GDP Growth | 2.50% | 1.40% | 2.50% | 1.40% |
| Personal Consumption | 2.20% | 2.40% | 1.50% | 1.60% |
| Gross Private Domestic Investment | 3.20% | 3.80% | 0.40% | 0.70% |
| Net Exports | 1.20% | 0.40% | 0.60% | 0.10% |
| Government Spending | 0.40% | -5.10% | 0.10% | -0.90% |
Data sourced from Bureau of Economic Analysis data tables as of 3/2/2026
As noted, the area driving the weakness of the report in relation to the first three quarters of the year was government spending. Most remember that the government was shut down from Oct. 1 to Nov. 12, which according to various estimates lowered fourth quarter GDP data by roughly 1% (annualized basis). If the shutdown hadn’t occurred, 2025 GDP growth may have been closer to the 3.1% range vs. the reported 2.2%. As usual, personal consumption expenditure was the biggest contributor to growth, particularly on an outright basis, being up 2.4% for the quarter vs. 1.4% for the headline number.
The star of the report
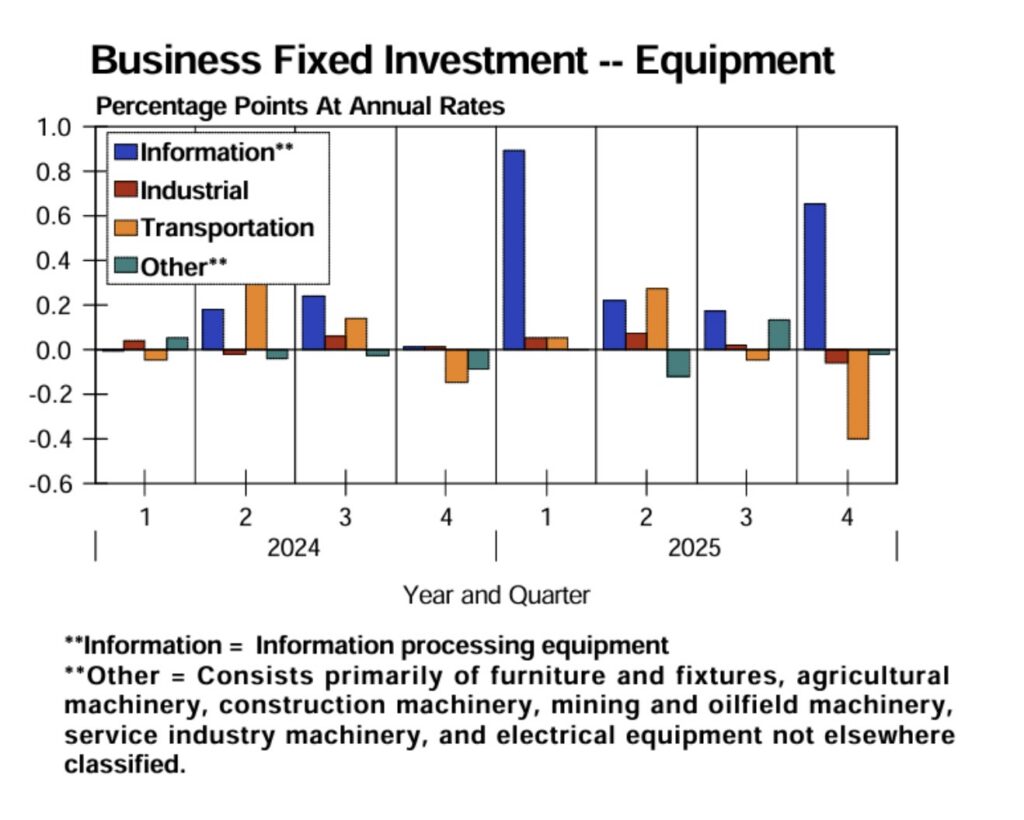
But the star of the fourth quarter report was Gross Private Domestic Investment, which includes business spending on plant and equipment, residential and nonresidential construction, inventory accumulation and intellectual property. The chart below2 highlights specific areas of equipment expenditure; lately, the driver of this data has been growth in the information segment, which represents spending on information processing equipment (computers and such).
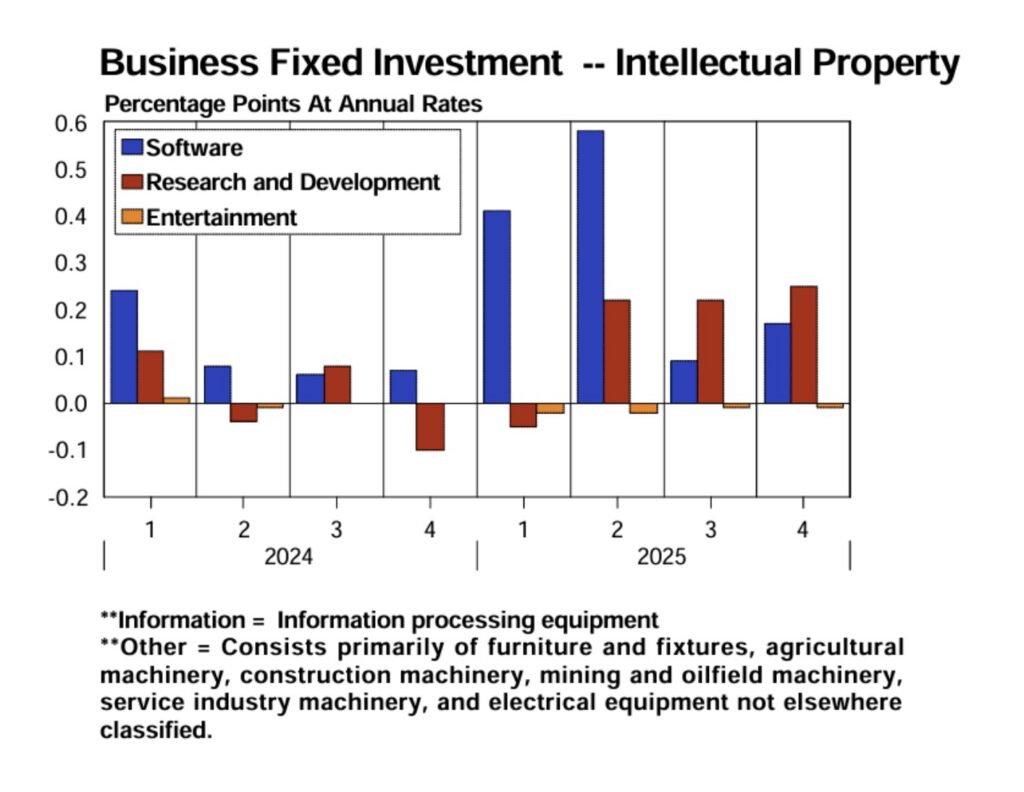
While the growth rate in equipment spending declined during the fourth quarter, growth of intellectual property was maintained at a strong clip as noted in the chart below2:
Inside baseball: Consumer goods purchases weakening
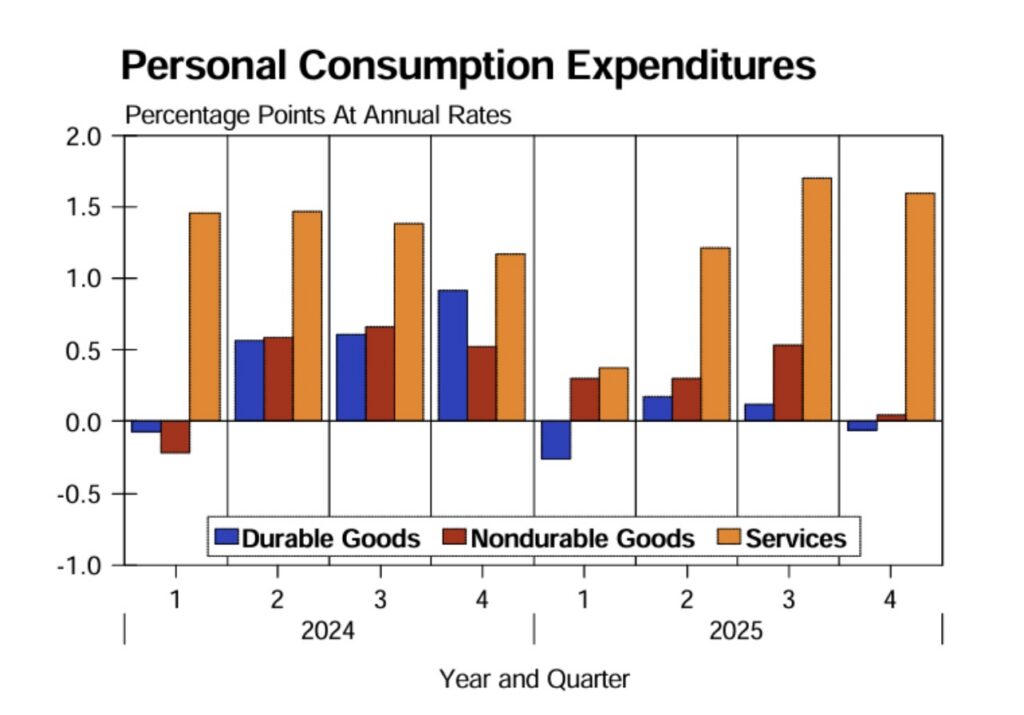
While it’s undeniable that the government shutdown was the main culprit of the weakening fourth quarter report, in his analysis of the latest data, Dr. Bob took time outlining his concern regarding consumer spending activity. The only area of consistent strength in consumer spending activity occurred in the services area, while weaknesses were apparent in both the consumer hard goods and soft goods categories.
As noted in the chart below2, we see that consumer durable goods expenditures (blue bar on chart) were weak for much of 2025. But spending on nondurable goods has deteriorated as well. Services spending remains reasonably robust. However, it should be kept in mind that the services category is dominated by health and housing expenditures, both of which are largely nondiscretionary spending. The higher end of the consumer income spectrum spends more money in the services area—as a percent of income—than they do in both durable and non-durable goods areas. This is another confirmation that the lower end of the consumer income spectrum is showing signs of stress.
Final word
Some believe that the weakening in GDP growth paves the way for the Fed to reduce interest rates. Maybe. But I doubt they will reduce rates in their March meeting. Most inflation data is showing 2.5%+ price increases. That is far from the Fed’s stated target of 2.0% inflation. April is Chairman Powell’s last meeting before the end of his term; I doubt he will push to reduce rates at the April meeting unless something is blowing up. He is only human.
Sources:
1Bureau of Economic Analysis; https://www.bea.gov/data/gdp/gross-domestic-product
2Charts provided by Dr. Bob Dieli at NoSpinForecast
3Federal Reserve Bank of Atlanta; https://www.bea.gov/data/gdp/gross-domestic-product
This commentary is provided for informational and educational purposes only. As such, the information contained herein is not intended and should not be construed as individualized advice or recommendation of any kind.
The opinions and forward-looking statements expressed herein are not guarantees of any future performance and actual results or developments may differ materially from those projected. The information provided herein is believed to be reliable, but we do not guarantee accuracy, timeliness, or completeness. It is provided “as is” without any express or implied warranties.
There is no assurance that any investment, plan, or strategy will be successful. Investing involves risk, including the possible loss of principal. Past performance does not guarantee future results, and nothing herein should be interpreted as an indication of future performance. Please consult your financial professional before making any investment or financial decisions.
Mariner is the marketing name for the financial services businesses of Mariner Wealth Advisors, LLC and its subsidiaries. Investment advisory services are provided through the brands Mariner Wealth, Mariner Independent, Mariner Institutional, Mariner Ultra, and Mariner Workplace, each of which is a business name of the registered investment advisory entities of Mariner. For additional information about each of the registered investment advisory entities of Mariner, including fees and services, please contact Mariner or refer to each entity’s Form ADV Part 2A, which is available on the Investment Adviser Public Disclosure website. Registration of an investment adviser does not imply a certain level of skill or training.