Navigating the AI narrative: Staying grounded in the data
Read time: 11 minutes
Artificial Intelligence (AI) may indeed contain elements of circular financing, but it’s also driving one of the most significant productivity and infrastructure buildouts in modern corporate history. The risk is real—but so is the opportunity. The two questions before us are: Is the overall market in a bubble, and are we in an AI bubble? We’ll address both questions below.
Executive summary—key takeaways
- Valuation alone isn’t effective in judging the health and likely future price direction of the equity market. In fact, it’s very ineffective when used in isolation.
- Current valuation of the S&P 500 level is justified by rising ROE and higher profit margins…this is NOT your grandfather’s index!
- Current valuation of S&P 500 technology stocks isn’t nearly as elevated as during the 2000 tech bubble and is supported today by robust earnings growth and profitability that was absent 25 years ago.
- Incestuous or circulating financing arrangements and the startling levels of AI-related capital spending in the news these days are noteworthy, but importantly such investments and spending are being funded by robust cash flow from operations of tech companies, NOT the scary borrowing activities of yesteryear!
- We take our signals from data and key financial indicators, NOT headlines, in evaluating whether “bubble” conditions exist. The three major factors that we watch for that are NOT occurring are:
- Hyper-scalers and tech OEMs cutting capital expenditure budgets?
- Semiconductor and hardware component inventories building excessively?
- Suppliers and vendors serving the AI and data center channel reducing activity and backlogs, e.g. suppliers of construction materials, fiber-optic cables, power turbines for electricity, etc.?
Are we in a market bubble? Valuation—given record high stock prices, are we in a price bubble?
In light of the cumulative 95% return in the S&P 500 from Sept. 30, 2022, through Sept. 30, 2025, including this year’s advance of more than 13% so far (subsequent to annual gains of roughly 25% each in both 2023 and 2024), this is an understandable question on investors’ minds.
Fed Chair Powell’s comments during the week of Sept. 22 that stock prices are relatively elevated echoed the cautionary phrase “irrational exuberance” first uttered on Dec. 5,1996, by then renowned acting Fed Chair, Alan Greenspan. Of course, we know how well that valuation warning by Mr. Greenspan was timed. The S&P went on to rise over 101% from that Dec. 1996 date through the tech bubble peak in March 2000.
The point…valuation alone isn’t an effective tool in evaluating market outlook, especially when the fundamental data and technical price trends are as constructive as they are today. It takes a comprehensive assessment of the fundamental, valuation and technical metrics to judge market prospects, in our view.
In that vein, market technicals set up nicely at this juncture. We like the still skeptical, sober sentiment in terms of current neutral rather than euphoric bull/bear ratios coupled with the healthy breadth of this advance as exhibited by the favorable number of stocks advancing versus declining. This isn’t a foreboding, narrow advance. Further comfort lies in the knowledge that the average S&P 500 price target on the part of peer market strategists also remains underwhelming, as opposed to settling-in at crazy optimistic levels.
Importantly, the 2025 advance so far has not been driven primarily by rising P/E’s; P/E levels have been volatile month to month in 2025, but they have remained pretty steady in that 22 to 23 times earnings level when comparing this Jan. 1, 2025, metric to today’s. Rather, it has been earnings growth that has been the main driver of price gains this year.
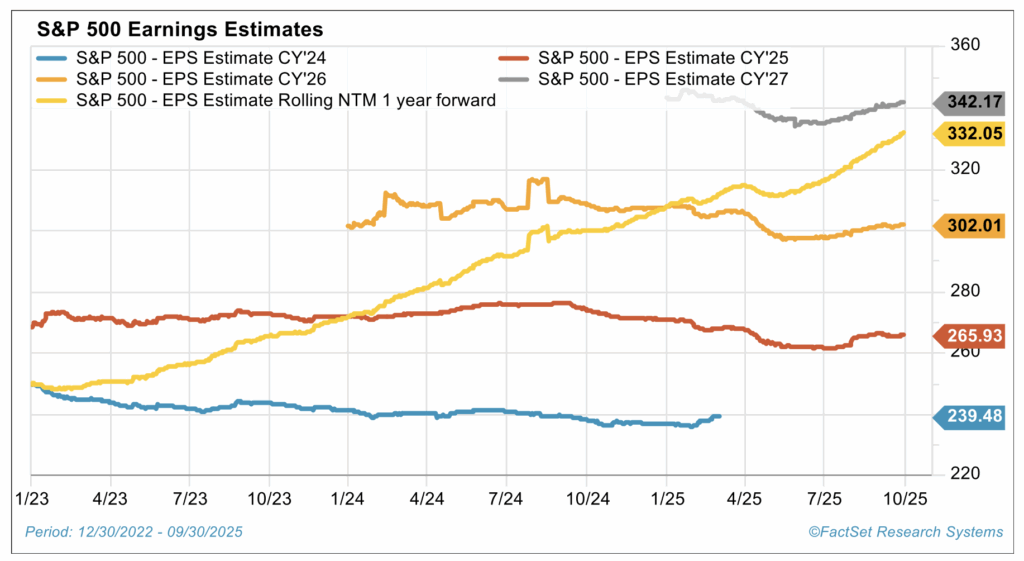
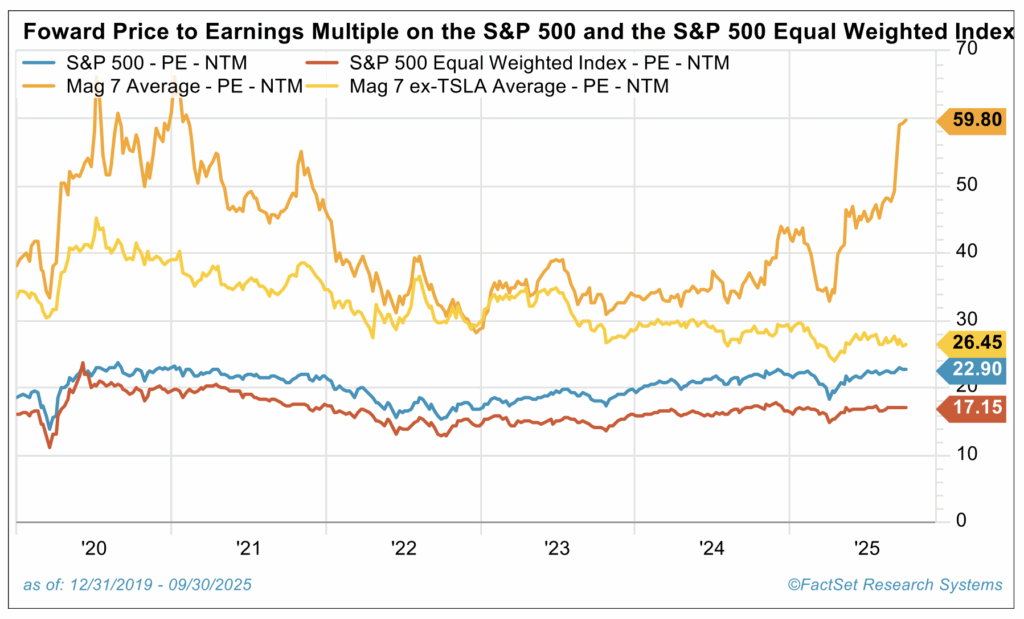
Yes, the S&P 500’s current P/E of 23 may look elevated when stacked against the oft-cited 50-year average of 16, but that comparison is both short-sighted and incomplete. This is not your grandfather’s index. The composition of the S&P 500 has shifted dramatically, with innovation and the rise of technology and services-oriented companies replacing much of the goods-producing corporate footprint of decades past. As a result, both profit margins and return on equity (ROE) have moved structurally higher.
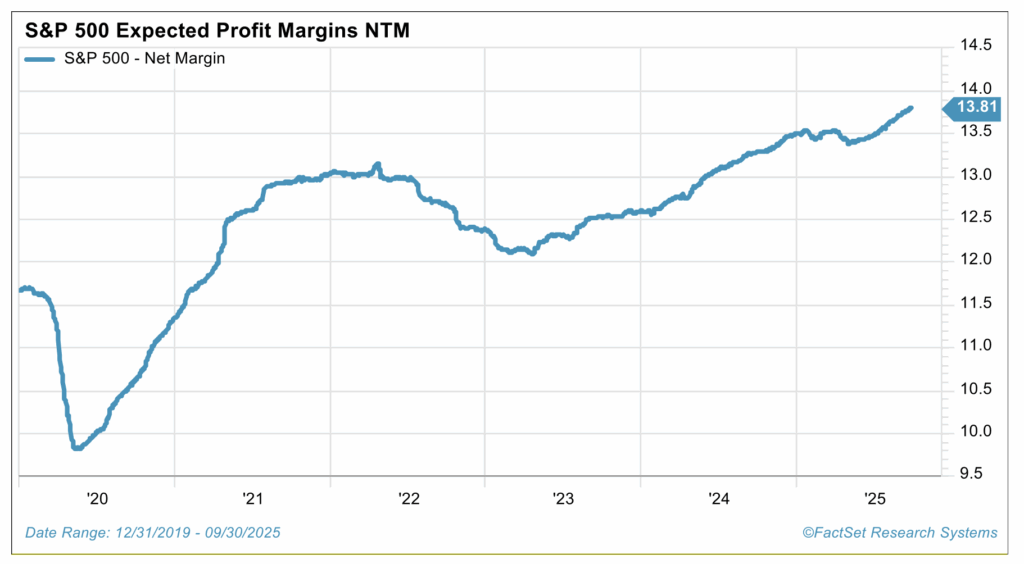
Over the past 25 years, the average ROE for the index was roughly 16%. Since the Great Financial Crisis, however, profitability has stepped up meaningfully, with ROE now closer to 19%. Net profit margins tell a similar story. They have averaged just above 9% over the past quarter century but are expected to reach an all-time high of 13.8% over the next twelve months. In that context, today’s multiple of 23x isn’t excessive. It’s supported by solid revenue growth, record-high margins and robust earnings power.
Additionally, such strength appears to be sustainable as innovation is driving a surge in productivity growth (as mentioned earlier). Both the creators of that innovation, particularly in the communication services and technology sectors, who are in the early innings of monetizing the new, revolutionary AI-related products and services, as well as the users of this innovation in virtually all the other various S&P 500 sectors, are benefiting handsomely.
As a final word regarding adequate context on this topic, we should also recognize that if you look at the S&P 500 equally weighted index—which adjusts for the disproportionate influence of the largest seven stocks, popularly known as “the Mag 7,” in the S&P 500 market cap weighted index—its P/E ratio of 17 is much lower and in fact quite close to the longer term historical average. Reasonable enough given strong fundamentals.
What would concern us, on the valuation front, would be if P/Es pushed substantially higher from here based simply on euphoria about possible further Fed rate cuts, especially if this was accompanied by a parallel rise in treasury yields. The S&P 500 is more vulnerable should earnings figures disappoint in some fashion from here. We wouldn’t want to see market valuation “melt-up” in the near term merely on sentiment and on unwarranted joys about prospective fiscal or monetary policy “fixes.” This could lead to subsequent meltdown. Steady eddy and an S&P 500 of 6600 to 7000 over the next several quarters would be just fine by us.
Are we in an AI bubble?
A recent Wall Street Journal piece—and others echoing similar concerns—highlighting the “circular financing” among major AI players has stirred investor anxiety and revived questions about whether AI enthusiasm has gone too far. We believe this deserves careful analysis—but through the lens of business fundamentals, not fear.
The interconnectedness of these companies undoubtedly amplifies systemic risk and is worth watching, but let’s be clear: such partnerships aren’t unique to technology. Companies have formed deep financial and operational ties for decades—often with positive results. Across industries, there have been countless mergers, joint ventures and minority investments where firms take stakes in one another to secure supply, accelerate innovation or expand into new markets.
For example, Volkswagen’s (VW) investment in QuantumScape (QS) gave it early access to solid-state battery technology, while Broadcom’s (AVGO) long-term supply deals with Apple (AAPL) have ensured reliable demand and mutual growth. Both partnerships created efficiency, strengthened supply chains and delivered real shareholder value. Similar dynamics can be seen in TSMC’s collaboration with Apple and Nvidia, which keeps chip production aligned with customer needs, and Amazon’s investments in Rivian and Anthropic, which support its logistics and AI ecosystems. These examples show how collaboration and shared capital can drive long-term success across industries.
The difference in today’s AI landscape—and what recent articles have brought to light—is the unprecedented scale of investment and the deep financial ties forming among industry leaders. Nvidia’s announced plan to invest up to $100 billion in OpenAI for a significant equity stake illustrates this vividly. In that partnership, Nvidia helps fund OpenAI’s expansion while securing one of its largest and most consistent chip customers. OpenAI, in turn, gains access to Nvidia’s cutting-edge hardware, keeping it ahead in the race for AI model performance. It’s a mutually beneficial arrangement that keeps Nvidia’s technology at the heart of the AI ecosystem.
This kind of interconnectedness does introduce risk—when spending on AI infrastructure eventually slows, weakness in one part of the chain could ripple across the ecosystem. Still, today’s environment is very different from the dot-com bubble. These relationships are designed to strengthen supply chains, accelerate innovation and support sustainable growth, not to inflate short-term profits or disguise weak demand. The data clearly shows we’re still in the early innings of this buildout, with capital spending, utilization rates and order backlogs all remaining strong.
Startling levels of AI-related capital spending funded by earnings and cash flow—NOT scary borrowing!
The key difference between today’s AI cycle and the tech bubble of the late 1990s is where the money is coming from. Back then, many fast-growing companies were valued on hype, not profits, and relied heavily on borrowed funds or speculative capital to stay afloat. Today, the picture couldn’t be more different. The leading players in the AI ecosystem—Microsoft, Nvidia and Alphabet, among others—are highly profitable, cash-generating businesses that are funding expansion internally. The AI revenue being reported is real, incremental and translating directly into earnings, creating a solid financial foundation rather than a speculative frenzy.
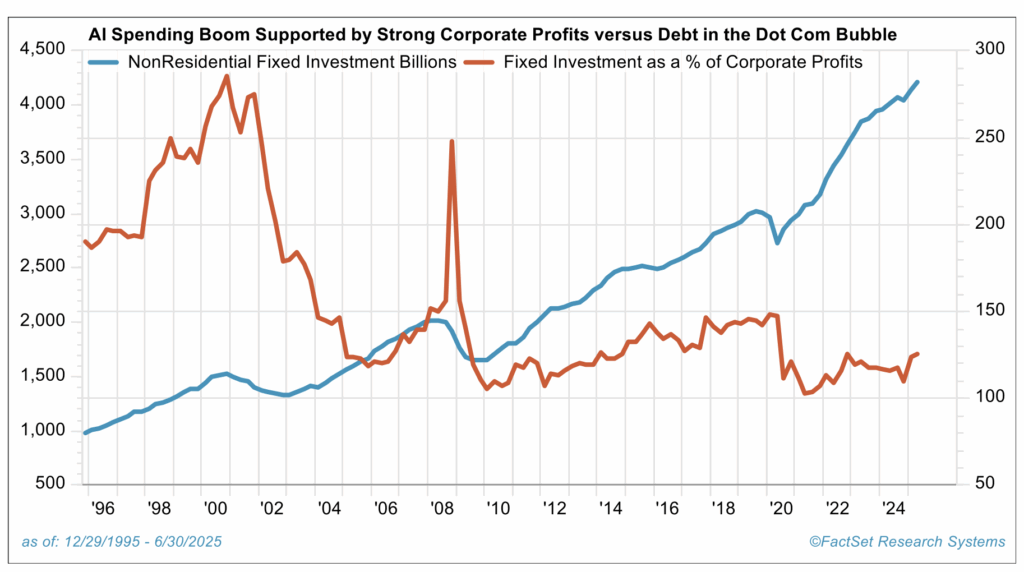
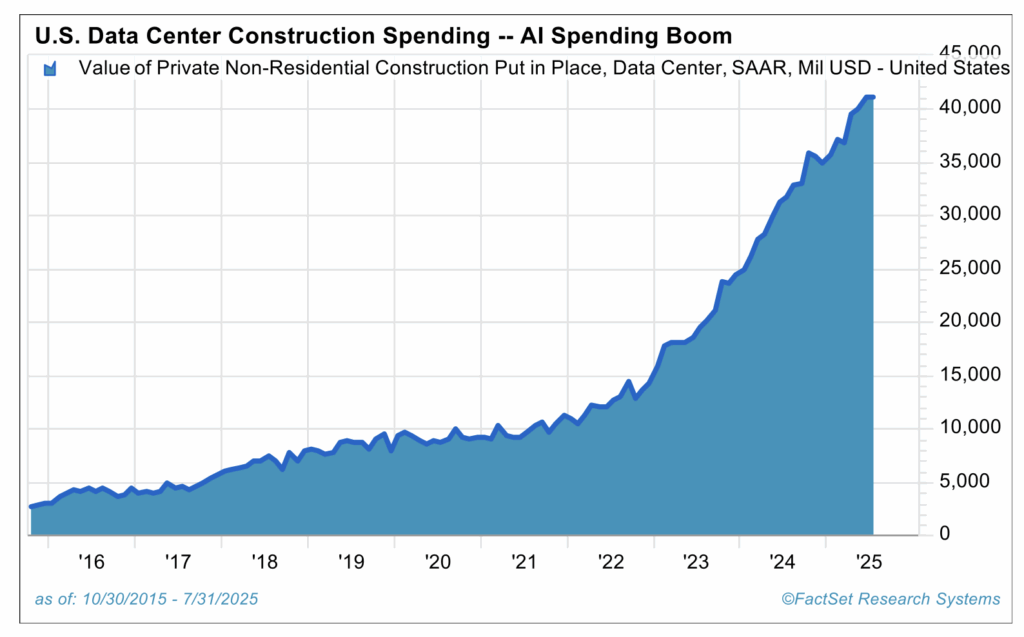
That profitability is what’s driving the startling levels of AI-related capital spending we’re seeing today. Companies are pouring billions into data centers, chips and network infrastructure—investment that is being supported by profits, not debt. Roughly $40 billion is being spent on data-center shells alone, about four times what was typical just a few years ago, excluding the specialized equipment that goes inside them. Supply chains remain healthy, and demand for AI infrastructure continues to outpace supply as businesses race to build capacity. This isn’t an overheated, debt-fueled spending spree; it’s a profitable reinvestment cycle grounded in strong balance sheets and high cash flow.
We would become more cautious if we started to see signs of weakness among key suppliers to the AI and data-center ecosystem—for example, at Corning (GLW), which produces optical fiber for data interconnectivity, or GE Vernova, which provides gas turbines for the massive power generation needed to run these centers. Both companies currently report strong order backlogs, supporting our confidence in the current environment. We would also be concerned if CapEx budgets began to roll over, signaling slowing demand or waning corporate confidence. For now, the opposite is true: spending remains elevated, and even short-term fears—like those sparked by the DeepSeek announcement in early 2025—have proven unfounded. We’ll continue to monitor the data closely and adjust our outlook as conditions evolve.
Conclusion: Balance and discipline
This environment calls for balance, not bravado. We’re not advocating that investors chase the latest surge in AI-related names. Within our internal strategies, we remain slightly underweight relative to benchmark indices, reflecting a disciplined, risk-aware approach. If AI-related gains have stretched portfolio allocations above target levels, the answer is measured rebalancing—not panic selling. The key is to stay grounded in the data: monitor earnings strength, capital-spending momentum and the overall health of suppliers. Participate in the long-term AI growth story—but do so with measured conviction, which helps ensure participation in the upside without full exposure to the potential correction that may occur later in the cycle.
This commentary is provided for informational and educational purposes only. As such, the information contained herein is not intended and should not be construed as individualized advice or recommendation of any kind.
The opinions and forward-looking statements expressed herein, as of November 3, 2025, are based on current information and are not guarantees of future performance. Actual results or developments may differ materially, and opinions are subject to change at any time. The information provided herein is believed to be reliable, but accuracy, timeliness, or completeness cannot be guaranteed. It is provided “as is” without any express or implied warranties.
There is no assurance that any investment, plan, or strategy will be successful. Investing involves risk, including the possible loss of principal. Past performance does not guarantee future results, and nothing herein should be interpreted as an indication of future performance. Please consult your financial professional before making any investment or financial decisions.
Indexes referenced are unmanaged and cannot be directly invested in. For index definitions visit https://www.marinerwealthadvisors.com/index-definitions/. Mag 7 stocks refer to Alphabet, Amazon, Apple, Meta, Microsoft, Nvidia and Tesla.
References to specific companies are provided for illustrative purposes only to demonstrate broader market or industry trends. They do not constitute a recommendation to buy, sell, or hold any security, nor should they be construed as investment advice. The inclusion of these names does not imply that any such securities were or will be profitable.
Mariner is the marketing name for the financial services businesses of Mariner Wealth Advisors, LLC and its subsidiaries. Investment advisory services are provided through the brands Mariner Wealth, Mariner Independent, Mariner Institutional, Mariner Ultra, and Mariner Workplace, each of which is a business name of the registered investment advisory entities of Mariner. For additional information about each of the registered investment advisory entities of Mariner, including fees and services, please contact Mariner or refer to each entity’s Form ADV Part 2A, which is available on the Investment Adviser Public Disclosure website. Registration of an investment adviser does not imply a certain level of skill or training.