The Big Picture: GDP Growth and Productivity

Read time: 12 minutes
Over the last 12 months, I have been writing about my longer-term vision of economic—and potential capital market—differences that may unfold. I have entitled this work “Passageways”—a theme suggesting that global economic, social and capital market factors will be different over the foreseeable future than has been the case over the last decade. Many are now writing and talking about these potential differences, so the concept that what the future holds may be significantly different from what the world has recently experienced.
This month’s commentary drills down into one of the differences that I see unfolding—that being that the days of never-ending disinflation (not deflation) by and large are probably behind us. I won’t go into the details of this thought, as I have written about this idea many times over the last year. But in this commentary, I’ll show that worker productivity growth is a strong elixir, the body armor if you will, that exists to fight the negative aspects of higher inflationary pressures.
The discussion regarding worker productivity growth rates is highly important. Worker productivity growth is the “mother’s milk” of higher standards of living and the creation of “societal wealth.” I’m not talking about someone’s 401(k) here, but rather the wealth of nations. This type of macro wealth is created by workers producing more than they consume, blunting much of the negative impact of rising inflation trends.
This month’s installment of The Big Picture will be the first of two. It will examine historical gross domestic product growth trends between countries. It will also highlight the first part of the GDP growth equation: the size of a country’s work force. The discussion regarding worker productivity will take place in next month’s commentary, after we understand the tie between GDP growth and population/workforce growth rates.
GDP Growth Here and Around the World
Let’s turn on CNBC and listen to the “talking heads.” Wait. Let’s not—and instead think about economic and investment concepts with a shelf life longer than fresh fish. Let’s think about economic and capital market factors that are the real, longer-term drivers of capital preferences and wealth creation. Let’s talk about sustainable, steady growth.
It’s been more than 40 years since I entered the investment community. Over that time, the U.S. economy has grown from $2.627 trillion nominal GDP to today’s level of $27.356 trillion, a gain of 1,041%.1 In 1979, the U.S. economy was the size of today’s French GDP.2 The output per capita in the U.S. is $76,329 versus the rest of the world at $12,743.3
The U.S. economy has been a marvel. Our dominance in growth and leadership has, over the long term, been the envy of the rest of the world. How much would most countries in the world give to have their own Silicon Valley or Ivy League? Priceless. We can only hope the advantages brought to the world by American ingenuity, drive and ambition will continue. At times I worry. The purpose of this commentary isn’t to sound the U.S. trumpet but to gain an understanding behind sustainable economic growth and with it, growth in societal wealth, driven by worker productivity growth.
To dive into the topic of economic growth whose two main factors are the number of workers in a country and the productivity levels of that force, let’s first take a peek at the lay of the macroeconomic landscape by viewing changes in economic “market share” that has occurred over the last 42 years. Let’s see how the economic growth derby has unfolded.
Consider the following macro data, from the World Bank (data in trillions, U.S. dollars):
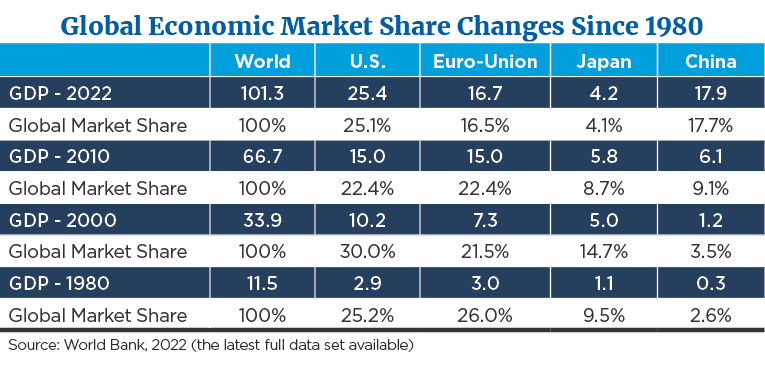
Some considerations come to mind when I review the previous data.
- What becomes clear is the major shift in global economic market share hasn’t moved from the U.S. to other powers, but rather from Europe and Japan toward China. The U.S. economy remains the world’s number 1 sole economic power by a large margin—something that becomes apparent to the politicians who rave about China “stealing” our economy when we look at the longer-term macro data. Viewed from the macroeconomic side of the equation, the folks in Europe and Japan should be up in arms about this issue, not Americans.
- I recall in the 1980s many thought that Japan was going to overtake the world. As noted, from 1980 to 2000 Japan’s economic global market share rose five-fold. However, since then Japan has stagnated, and their market share is a fraction of what it was 22 years ago. Now, many believe China will overtake the U.S. in global economic prominence. I doubt this will happen as long as hard-line communists control China’s economy.
- Within the time frames noted above, we see that Europe lost global market share between 1980 and 2000. Over that same time, Japan and the U.S. were the major beneficiaries of Europe’s loss.
Population Growth to Stagnate in Major Economies
So, what drives overall nominal economic growth? Two factors to consider are the size of the population base (workforce) and the productivity of that workforce. Add these two factors together and one comes up with nominal GDP. So, let’s take a look at these two major factors and compare them on a relative basis.
The International Monetary Fund has done some comprehensive work on projected population growth by country and by region, so the data presented on future population levels comes from its website.
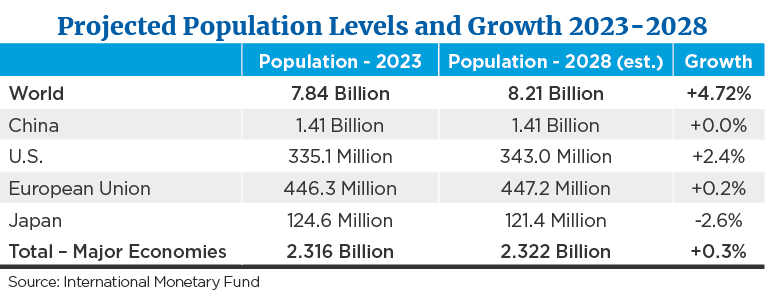
Looking at the data above in total, you will see the total population growth of the world’s major economies is expected to total about six million people over the next five years, an average annual growth rate of less than 0.1% per year.
To the degree that population growth is one of the main drivers of overall GDP growth, and potential equity market returns, it appears the “sweet spot” is in Asia—outside of Japan and China. Think of Bombay and Singapore, not Tokyo and Shanghai.
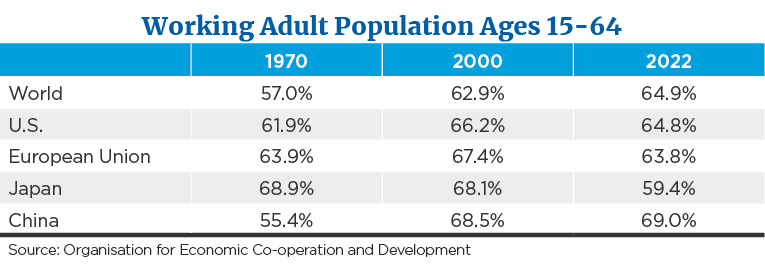
Breaking Down the World’s Population
While it is important to understand overall population growth trends, it is also important to gain a grasp of the size of the workforce within that country’s population. Data pertaining to the percentage of population between the working ages of 15-64 are noted below.
In addition, it is important to understand how many citizens are in the “retirement” or non-working stage of their adult lives. Let’s call this the “dependency ratio,” or the number of retirees per 100 people within the working age noted above.
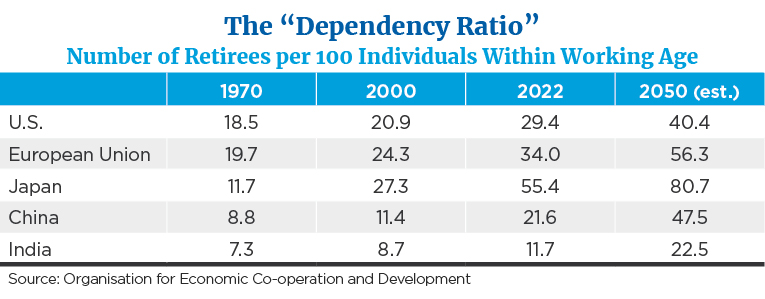
I included India at the bottom of the table to illustrate a country that won’t be as challenged to provide economic assistance to older citizens as the current major economic powers. But make no mistake: the world in total is aging.
All the historic and forward-looking demographic data illustrates that the world in total is going to rely more heavily on worker productivity growth going forward than has been the case over the last 40 years.
Labor Productivity: Mother’s Milk of Wealth Creation
When thinking of GDP growth in the developed world, it becomes clear that worker productivity growth rates will probably be the driver of overall economic well-being as the world moves forward. In his book “The Birth of Plenty,”William Bernstein expresses his view that the best predictor of the building of societal wealth, which eventually leads to more comfortable, longer lives for future generations, is individual worker productivity growth. Worker productivity growth rates are among the most powerful economic measures we can discuss.
And importantly for the “Passageways” discussion, the higher the level of worker productivity growth, the less companies will need to raise prices due to higher unit costs of manufacture. An example: If a worker is producing 100 widgets per hour and is paid $100 per hour, the labor cost of manufacture is $1 per widget. If the worker increases output to 200 widgets per hour, the labor cost of manufacture is $.50 per widget. The worker could then ask for a pay raise without impacting the employer’s bottom profit line. There would be little to no reason to raise the price of widgets. This is a simple example of why worker productivity growth rates are very important.
Take that example and multiply it by the 60 million workers in the U.S. and one gets the picture of why worker productivity growth rates are meaningful. Let’s take this example one step further. If the worker’s pay rises, but the prices of goods and services rises by less than income, the worker can either consume more or save the extra money. If savings occurs, on a macro scale, societal investment rises along with savings, leading to better, longer lives for the workforce and society in total.
Higher Worker Productivity Leads to Better, Longer Lives
Think I exaggerate when I say that worker productivity growth drives human life expectancy? Bernstein highlights the fact that until the Industrial Revolution, the average person worked in the fields on a farm, creating subsistence for himself and his family. In 1860, 53% of the workforce worked on the farm, living a hand-to-mouth existence. The replacement of the horse-drawn plow with the tractor and cotton gin increased worker productivity to the point where the majority of Americans didn’t need to work on the farm to feed themselves. The mechanization of the farm allowed farmers to move to the city factory, driving national productivity gains and the Industrial Revolution. By 1920, less than 30% of the American workforce was still working on the farm.
As workers moved away from the sustenance work on the farm, they started to produce more than they consumed, and the excess production turned into societal savings. These savings were invested in additional productive capacity, which increased productivity and production, which increased savings… you get the point. Eventually, excess savings were available on a societal basis to fund research and development of drugs, vaccines and health services, so life expectancy was increased.
Want proof that worker productivity drives longer lives? Let’s start by looking at worker productivity. From 1980 to 2019, worker hourly productivity in China grew by 550%, or by 3.9% per year, a very big number over a very long time. Next, ask the old citizen in China about the future of his grandchild, and he will believe that the child will live better, and longer, than himself. He would conclude this from experience. From 1970 (prior to Deng Xiaoping’s economic reforms) through 2021, life expectancy in China increased dramatically from 58 years to 71 years, an increase of 13 years’ expectancy in a relatively short period. To compare, life expectancy in the U.S. increased from 71 to 76 years over the same period.4
Bernstein goes on in his work to suggest that in all history, in all cases, he found there are necessary factors that have to be present for a society to gain real, sustainable productivity growth that leads to societal wealth and longer citizen lifespans. These four factors are:
- The existence and governmental protection of property rights.
- The belief in and funding of scientific rationalization.
- The existence and support of advanced capital markets.
- The existence of an efficient transportation system (which includes the transportation of information and ideas).
Bernstein argues that without the existence of all four of these factors, the world has not experienced an economy where worker productivity growth has been strong and a society that has created sustainable, growing societal wealth. If Bernstein is right—and I think he probably is—then investors need to consider these main drivers, which sets the stage for continuing worker productivity growth rates.
The Next Chapter and Final Word
Along with the four societal factors noted above, what are some quantitative drivers that have historically led to higher worker productivity? Does society just ask workers to work “harder”? No. High and rising worker productivity growth rates have been associated with three main macro factors, those being education levels, capital intensity rates and innovation.
In our next installment of the “Passageway” discussion, we will examine these three factors and how the U.S. and the rest of the world stacks up with those main drivers behind this important issue.
Sources:
1,2,3,4World Bank
This commentary is for informational and educational purposes only and is limited to the dissemination of general information pertaining to Mariner Wealth Advisors’ investment advisory services and general economic market conditions. The views expressed are for commentary purposes only and do not take into account any individual personal, financial, or tax considerations. As such, the information contained herein is not intended to be personal legal, investment, or tax advice or a solicitation to buy or sell any security or engage in a particular investment strategy. Nothing herein should be relied upon as such, and there is no guarantee that any claims made will come to pass. Any opinions and forecasts contained herein are based on the information and sources of information deemed to be reliable, but Mariner Wealth Advisors does not warrant the accuracy of the information that any opinion or forecast is based upon. You should note that the materials are provided “as is” without any express or implied warranties. Opinions expressed are subject to change without notice and are not intended as investment advice or to predict future performance. Actual results or developments may differ materially from those projected. Consult your financial professional before making any investment decision.
Mariner is the marketing name for the financial services businesses of Mariner Wealth Advisors, LLC and its subsidiaries. Investment advisory services are provided through the brands Mariner Wealth, Mariner Independent, Mariner Institutional, Mariner Ultra, and Mariner Workplace, each of which is a business name of the registered investment advisory entities of Mariner. For additional information about each of the registered investment advisory entities of Mariner, including fees and services, please contact Mariner or refer to each entity’s Form ADV Part 2A, which is available on the Investment Adviser Public Disclosure website. Registration of an investment adviser does not imply a certain level of skill or training.