The Big Picture Final Chapter: Worker Productivity

Read time: 9 minutes
Over the last year, I have written about my longer-term vision of economic and capital market differences that may unfold going forward. I have entitled this work “Passageways”—a theme suggesting that global economic, social and capital market factors will be different over the foreseeable future than has been the case over the last decade.
Many are now writing and talking about these potential differences, so the concept that what the future holds may be significantly different from what the world has experienced in the recent past isn’t limited to my own thought process—many others, much smarter than me—are also thinking along the same lines.
In a nutshell, I see the factors that had led to strong disinflationary forces between 1982 and 2020 changing. I suggest the largest single driver of global economic well-being over the last few decades has been the relentless globalization of the world’s economy. The globalization of the economy has led to very low inflation rates—the lowest we have witnessed in almost a century. These forces are changing. Globalization as a percentage of worldwide gross domestic product is shrinking and has been for a few years.1
Worker Productivity and Societal Wealth
This month’s commentary continues and finalizes last month’s discussion regarding worker productivity growth rates. For those who didn’t read (or don’t recall) last month’s work, I hold the view, as many do, that one of the most important variables that drives overall social well-being is worker productivity growth. Worker productivity is a strong elixir, the body armor if you will, that exists to fight the negative aspects of higher inflationary pressures.
I will go so far as to suggest that worker productivity growth rates have gone hand in hand with a country’s life quality and yes, life expectancy itself. Worker productivity growth allows a society’s workforce to produce more than it consumes. The “excess” production then turns into investments of various types and allows the building of what we economists call “societal wealth.”
This month’s installment of “The Big Picture” is the second installment of two. Last month we examined the importance and current positioning of various countries’ GDP growth rates and discovered that the size of a country’s workforce is a main driver of GDP growth and a nation’s societal wealth. This month we turn to what I would argue is the more important of the two variables that drive overall GDP growth: the productivity of each individual worker. We will examine the historical and current status of major nations’ worker productivity rates and provide variables that drive a nation’s productivity growth rates.
Workers and Productivity: The Keys to Sustainable Economic Growth
Let’s dive into the topic of economic growth, whose two main factors are the number of workers in a country and the productivity levels of that force. Last month I drilled down into the historical and projected growth rates of major economies’ labor forces. In this chapter, we will discuss the productivity of that work force.
Main Factors Affecting Worker Productivity Growth
There are many factors that drive a nation’s worker productivity growth rates. I suggest the main factors are innovation and capital deployment. One (innovation) may not be the sole property of one nation or the other, as over time innovations tend to travel across national borders. But many innovations are protected by global patent and copyright laws, so for some time, many innovations tend to help one country’s worker productivity growth rates to accelerate above others’.
A significant driver of innovation is the educational level of a society. Effectively, a society that places a high value on education fosters innovation to occur. Scientists, engineers and medical professionals tend to bring real innovation to society. Most of these innovators tend to be highly, and well, educated.
Capital deployment can be viewed as the “stuff” that greases the wheel of innovation and the application of those innovations to the benefit of workers, and society, as a whole. Capital deployment (capital spending) can be measured.
Education
Let’s start off by discussing the education levels of various societies. I provide information from two major sources that measure relative national education outcomes. The G20 and U.S. News & World Report are my main sources of educational data. The G20 comprises 19 member countries, along with the EU, which rank as the larger economic countries globally. The U.S. News database covers numerous countries, but my focus is on the G20 countries within its database.
If we combine the outcomes of both the G20 and U.S. News databases, we find within the G20 universe that South Korea ranks as the large country with the best primary and secondary school systems. Other top performers include #2 Germany, #3 U.K., #4 Japan and #5 France. China ranks #9, while the U.S. ranks #6. The poorer performers include Saudi Arabia, South Africa, Brazil and Indonesia. The rest fall in the middle.
Along with primary/secondary rankings, I think it is important to highlight higher education quality within countries. I use the U.S. News & World Report data, which ranks the world’s universities for research excellence and global quality reputation. Of the 20 top universities, the U.S. has 15 representatives, the U.K. has four and Canada has one.
If we combine both ranking systems, we find the U.S. is in a very strong position relative to the rest of the world with a ranking of #6 out of the G20 and 75% of the world’s top research-based universities. I suggest the education system in the U.S., while not perfect, appears able to bring real competitive advantages to the U.S. on a continuing basis.
Innovation
Innovation is where the education effort and spending start to pay off from an economic and societal wealth creation standpoint. People becoming well educated in and of itself is a fine occurrence, but it may not help an economy in its entirety unless innovation of some kind takes place.
How can we measure innovation? One way is to look at patent filings by country over time. Patent application rates can be justified for a number of reasons other than labor productivity gains, but they are a sign of a country’s commitment and effort on innovation.
According to the World Bank, average annual increases in patent applications growth has been +3.7% per year (1985–2021). Over the same period, applications in the U.S. grew by 4.1% per year. In Europe/Central Asia, filings increased by an average of 2.2% over the same period. In Japan, filings rate of change was -0.6% per year. Over the period of 1985 to 2021, China proved to be the main driver of patent filings growth at an annual rate of 15.4% per year. That number is distorted, as the base in 1985 totaled a mere four filings.2
So, the main drivers of innovation on a global scale over the last three-plus decades have been the U.S. and China as compared to both Japan and Europe. It is little wonder that GDP growth rates in both China and the U.S. have been much stronger than those experienced in Europe and Japan.
Capital Deployment
It is great to have strong education systems with the stuff to create new innovations and a large number of new patent registrations that occur when new ideas surface. But the “rubber meets the road” when financing is available to bring those new innovations to the marketplace, adding to the possibility of higher worker growth rates. In other words, the money has to be available to back up the system of new ideas. Below find comparative data regarding individual countries’ capital spending rates.
Capital Spending Rates by Country
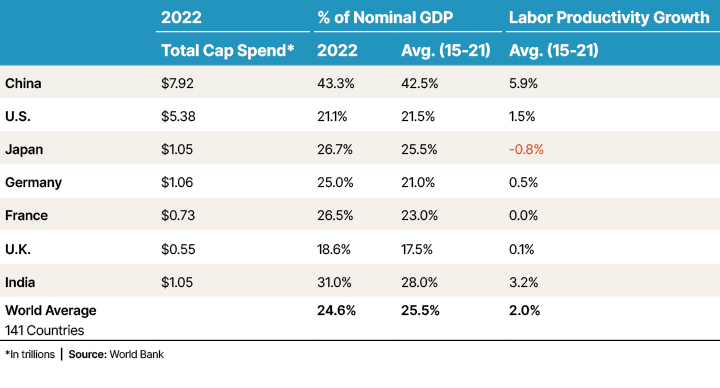
By simply looking at the data above, one sees a cause and effect in play between historical capital spending and labor productivity growth rates. Statistically, there is a strong 0.88 correlation factor at play with this data. In other words, the percentage of GDP that is spent on capital spending correlates 88% of the time with a resulting change in labor productivity growth rates.
One column that isn’t included in the data above is capital spending and labor productivity growth rates of the East Asia/Pacific region in total. From 2015 to 2021, this region of the world saw an average capital spending/GDP rate of 34.5% (as compared to the world average of 25.5%). Labor productivity growth rates for the region were 4.2% annually as compared to 2.0% for the world in total.3 Over this period, this was THE center of overall global economic growth and life improvements.
Near-Term Inflation Help
What of the shorter term? Does an enhancement in innovation/capital deployment lead to shorter-term economic benefits? If these changes lead to an increase in per-unit manufactured labor productivity, then yes. Think of it from the business owner’s standpoint. If the cost to create/distribute a product rises, but the labor component rises slower than the output level, then the need to pass along higher prices to customers is lessened. From a macroeconomic standpoint, labor cost inflation tends to lessen when labor productivity rises.
Final Word
So, the three demonstrated, highlighted variables that feed into a rise in labor productivity are education, innovation and capital spending. I harken back to the paper I wrote last month that outlined William Bernstein’s view that the reason societies and mankind enjoy rising living standards is centered on worker productivity growth rates, which creates societal wealth. In his work, Bernstein outlines four core, bedrock factors, necessities if you will, for productivity growth rates to rise consistently:
- The existence and governmental protection of property rights
- The belief in and funding of scientific rationalization
- The existence and support of advanced capital markets
- The existence of an efficient transportation system (which includes the transportation of information and ideas)
I suggest these variables, along with population growth (labor force growth) and a society’s focus on and commitment to worker productivity growth rates, lead to higher, sustainable economic growth rates. These higher growth rates then lead to higher levels of societal wealth, which fosters better, and longer, lives for all.
Sources:
1,2,3World Bank
This commentary is provided for informational and educational purposes only. It is not intended to be personalized advice or a recommendation to buy or sell any security or engage in a particular investment or other strategy. Nothing herein should be relied upon as such, and there is no guarantee that any claims made will come to pass. Actual results or developments may differ materially from those projected. The information is deemed reliable, but we do not guarantee accuracy, timeliness, or completeness. It is provided “as is” without any express or implied warranties. Any opinions expressed are subject to change without notice and are not intended as investment advice or to predict future performance.
Investing involves risk and the potential to lose principal. Past performance does not guarantee future results. Please consult your financial professional before making any investment or financial decisions.
Mariner is the marketing name for the financial services businesses of Mariner Wealth Advisors, LLC and its subsidiaries. Investment advisory services are provided through the brands Mariner Wealth, Mariner Independent, Mariner Institutional, Mariner Ultra, and Mariner Workplace, each of which is a business name of the registered investment advisory entities of Mariner. For additional information about each of the registered investment advisory entities of Mariner, including fees and services, please contact Mariner or refer to each entity’s Form ADV Part 2A, which is available on the Investment Adviser Public Disclosure website. Registration of an investment adviser does not imply a certain level of skill or training.