From Santa to the Easter Bunny: Rally Momentum or Melt-Up Zone Ahead?

Read time: 14 minutes
“Sell in May and Go Away.”
— An old investment adage with roots dating back to 18th century England. Also known as the “Halloween Indicator.”
The Santa Claus rally that started in October 2023 and saw the S&P 500 surge by 14% in last year’s final two months,1 including a record-setting 10 consecutive weeks of gains in the index,2 simply kept going as we moved into 2024. It morphed into an Easter Bunny celebration that gave investors much to enjoy—specifically, a great start to the year as captured by the return of more than 10% in 2024’s first quarter and the best Q1 showing for the S&P 500 since 2019,3 a year in which it went on to advance more than 30% for the full calendar year.4
In some ways, the 2024 Easter season run was even more impressive than the 2023 season of Christmas cheer, even if it wasn’t as robust. We give it superior style points, for sure. It was far broader in scope. Ten of the 11 S&P 500 sectors posted gains. Both the equal-weight S&P 500 index and the market-cap-weight S&P 500 index (that is far more concentrated across its constituents and heavily influenced by the Magnificent 7 that everyone reads about) hit new highs and secured returns of more than 30% and 40%, respectively, off their October 2022 lows.5 This served to affirm that each of these indices is in a solid bull market phase (with the generally accepted definition of a bull market being a sustained run of 20% or more in mind). This fact alone should dispel the exaggerated and misleading assertion that stock returns have been dysfunctional and narrow.
Signs of a Healthy Market
Clearly, this data illustrates that it’s not like the Magnificent 7 are doing well and the other 493 stocks are doing poorly, as implied in the headlines. Yes, the former have done quite well, but so have the other 493. It is more like a situation where a small group is doing very well and the rest are only doing quite well rather than a story of the haves and the have nots! We were pleased to see sectors such as Industrials, Energy, and Financials post solid gains while non-Magnificent 7 tech holdings continued to contribute handsomely to index returns. This is a good sign for future advancement in the market and explains the supportive metrics in the percentage of stocks trading above their moving average and the healthy trend in the advance-decline line (the number of stocks advancing versus declining that has a nice, positive slope).
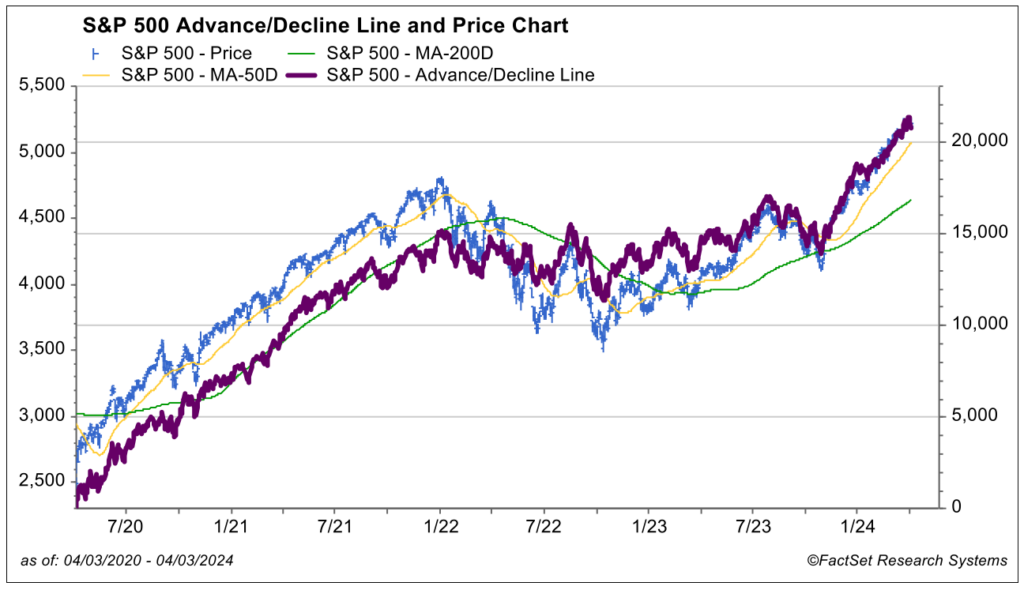
In fact, we found it interesting that the S&P 500 generated a healthy double-digit return in Q1, yet several of the Magnificent 7, such as Apple and Tesla, fell in price for the period. This, coupled with solid returns in the international equity indices and in small-cap stocks, completes the current picture of broad well-being and widespread participation in stock land.
What Drove This Strength in Q1?
This was not an advance simply based on giddy sentiment, investor fears of missing out or speculative excess, in our view. It was based on solid trends in the fundamental economic and earnings data as well as some positive signals from the Federal Reserve on likely policy going forward and public release of its economic and interest rate outlook. This constructive backdrop/trend stands in stark contrast to the fears of recession, earnings collapse and worry of hyperinflation and associated never-ending Fed rate hikes that were ever present in 2022 and 2023. We truly believe these 2023 key “wall of worry” items are legacy issues that have largely been resolved with far better-than-once-feared outcomes.
Regarding news at the Fed, the message at its March meeting was about as good as it gets. It was balanced and supportive. What is the phrase about a worrier who “dies a thousand times before his death”? I think William Shakespeare had that script right, and it applies to exaggerated investor anxiety over “Fed Think” earlier this year. A mere couple of months ago, many were agonizing over the fact that the “market” (per the fed funds futures curve) was looking for six cuts, while the Fed was messaging only three cuts this year. It was believed in more bearish camps that this gap in market expectations versus Fed intentions would cause a stock market meltdown this year. It is fascinating how quickly—in just a few weeks—the market got a better grip on things and became comfortable with the realization that inflation was continuing to calm while the economy was being very resilient and that the Fed could indeed go slow and be measured in cutting. Such is the fickle nature of the fed funds futures market.
Economic Strength Boosts Fed Confidence
We have been steady in believing three cuts are fine and that the Fed is now in the driver’s seat. Indeed, the Fed confirmed this in its post-March meeting presser. The dot plots Fed policymakers released in March reiterated that they planned to cut three times in 2024 and felt more confident inflation was continuing to ease, despite the economy growing solidly. In their Summary of Economic Projections (SEP), they increased their 2024 real gross domestic product growth projections from 1.4% up to 2.1% and lowered their projected year-end unemployment rate from 4.1% to 4.0%. At the same time, they maintained year-end inflation targets in the mid-2% range. This “tastes great, less filling” message was well received by investors. And this is real stuff … Goldilocks/soft landing data will move markets when folks are skeptical and anxious that such a scenario can really play out. Again, this has been our base case for some time.
As for other signs of economic strength while inflation calms, consumer confidence and CFO confidence are firming. The tightness in the labor market is easing as seen in rising labor productivity and declining quit rates and job openings data. The service sector continues to see healthy revenues as consumers continue to travel, eat out and crave experience. Even the manufacturing sector, per the ISM Purchasing Manager’s Survey, went into growth mode again in March after 16 consecutive months of modest contraction. Capital spending is tracking quite well and supported with reshoring and infrastructure initiatives. Consumer spending is healthy and is being driven by consistent job growth and gains in average hourly earnings.
This has all translated into better-than-expected earnings trends and positive revision for earnings and margins for 2024 and 2025. These are all fundamental factors that drive stock prices.
Are We Taking Our S&P 500 Target Up?
In a word, no. As the table below shows, our base case calls for a year-end price target of 5,200 on the S&P 500 with upside to 5,400 in an optimistic case.
2024 Base Case – Back to Normal
Expected Environment
- Real GDP growth is in a range of 1.5%-2%.
- Federal Reserve cuts rates three times or more in 2024. Longer-term rates settle in a range of 3.75%-4.25%. However, increased volatility could see that range widen to 3.25%-4.50%.
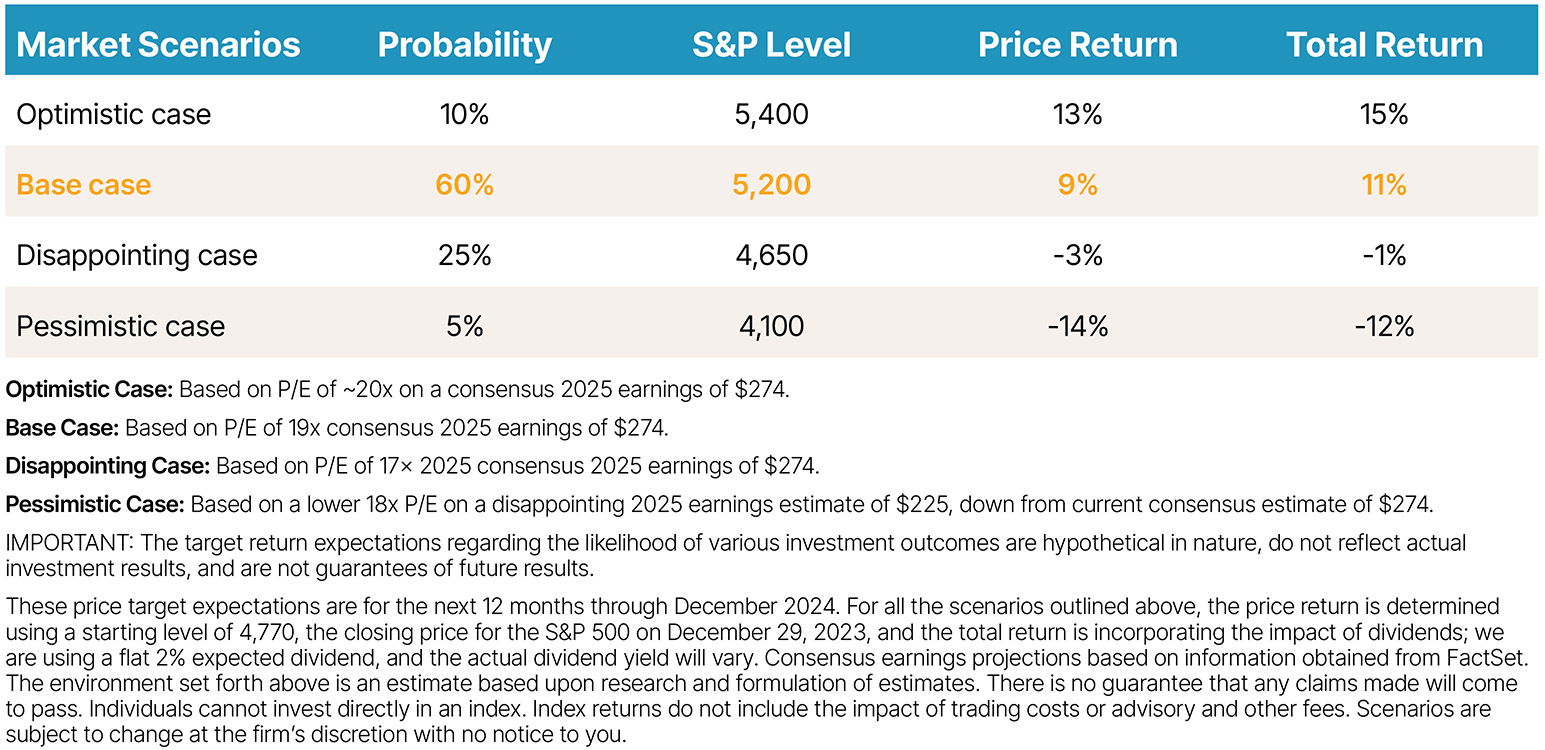
This is part of our “back to normal” thesis and predicated on solid/normalized levels of GDP growth, interest rates, inflation, labor conditions and earnings growth in the high single-digit to low double-digit area. We believe that a 19 to 21 times price-to-earnings multiple on these earnings projections, supported by these other assumed metrics, is reasonable. We’re not all that comfortable if P/E’s climb much above that level. This outlook produces the high-conviction expectations of a 5,200 to 5,400 price target, and we see no reason to adjust them, despite the fact that the S&P 500 is trading slightly above 5,200 at this writing.
Our message going into this year was to expect a positive price trend and solid double-digit returns for calendar 2024 … it remains so! If we are wrong and investors currently sitting on cash want to get giddy about positive trends in policy and fundamentals and inspire a sort of melt-up in stock prices well above our target, so be it. We’ll never apologize for being a tad conservative while getting the trend correct. Should such exuberance surface, we would likely suggest taking profits and rebalancing back to normal equity allocations, as such a melt-up would clearly take allocations above our normal long-term strategic recommendations.
Further, our internal equities team, which manages a number of strategies with various risk-return objectives invested in individual stocks, appreciates the fact that we are not constrained by investing passively in the indices. Rather, we have the opportunity, through active stock selection, to add value to the passive approach if we are successful.
What About Risk Factors?
First of all, let’s embrace the fact that as part of our “back to normal” theme, market corrections of 10% to 20% that shake investor psychology can occur at any time for various reasons. Such corrections are normal and sometimes significant. Think of the five-week 35% correction in the S&P 500 in February/March 2020 or the 21% intramonth correction in December 2018 that were followed by robust moves to new highs in short order. These were of the larger variety, but they are reminders that they are not always of the milder species such as the 11% short-lived swoon in the summer of 2023 on the way to a 26.3% gain for the full calendar year. We should accept the fact that after a hard run like we have seen over the last 17 months, this would not come as a surprise. What might cause this?
- Election anxiety
- Regional wars that drive oil prices higher/cause spikes in inflation
- Bond vigilante revolt over fiscal debt
These are all items that could create volatility on a temporary, as opposed to a more sustained, basis. At present, we don’t see them spilling over into anticipated 2024/2025 earnings and economic growth. We think they can be managed adequately should they arise or elevate to higher levels or that they are lower-probability issues. Regardless, we have already written about each extensively. Look for our upcoming Equity Team quarterly report in which we will provide updates on all of them.
Seasonality: A Likely – and Timely – Headline Item
About this time of the year, the “watch out for tough seasonality” argument is trotted out and trumpeted, so we bring this up as a headline item du jour. This argument for caution asserts that the summer doldrums rain down on the market as many investors go on vacation. Hence, the quote at the beginning of this month’s commentary. It channels the old investment wives’ tale that perhaps investors are smart to sell their stock holdings in May and not reinvest in stocks until November. The real, original quote is: “Sell in May and go away, do not return until St. Leger’s Day.” Rumor has it this phrase and notion dates back to old England when stockbrokers would leave for summer holiday in May and not return until the final horse race of the season, which happened on St. Leger’s Day in the fall.
Over the years, this became more than nostalgia for certain investors who observed that some of the worst drawdowns in the market happen in October; to wit, the October 1987 crash, the crash of 1929 in October of that year and the Lehman Brothers collapse in September 2008, among others, that all happened in the May to October period. Average monthly returns for some of the summer months aren’t quite as strong as months in the other three seasons. In addition, market historians couple these two facts and point out that the average return for the S&P 500 is not as strong from May through October as it is from November through April.
This observation is used to introduce and support the supposed wisdom of the “Sell in May” concept. Once again, this kind of information tends to get exaggerated and result in incomplete or misguided conclusions. Frankly, the “Sell in May” proposal misses the mark, in our view. Average returns for these two seasonal chapters are both still positive. Why would one sell and miss positive returns? The table below shows S&P 500 returns from May through October going back to 2011. Returns are in the black 80% of the time.
S&P 500 Total Return During the “Summer Months”
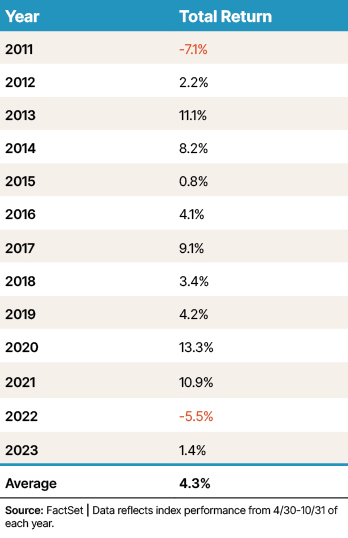
Going back to 1973, S&P 500 returns in this period were positive 70% of the time, and sometimes handsomely so. 2020 is a great example of the cost of employing a “Sell in May and Go Away” strategy. The S&P 500 fell 34% in five weeks during February/March (which falls in the premised superior November to April time frame) as noted above, yet it advanced 12.3% from May to October (the premised inferior time frame) that year. What a whiff that year if you missed out on those summer returns that this old wives’ tale would have had you do. Further, there is no causation or predictive value in this wives’ tale. Bottom line, a buy-and-hold strategy has outperformed the “Sell and Go Away” strategy over the last 10, 20 and 50 years. Enough of seasonality!
Wrap-Up
In summary, the S&P 500 has rallied nicely from the 2022 lows and currently remains in a bull market phase for good reason. In fact, it has already achieved our 5,200 base case price target for the entire calendar year. In our Crystal Ball presentation, we stated we could envision upside to the 5,400 level in 2024. We are not adjusting up/positively revising our price targets for the index at this point. Both represent nice double-digit gains for the year. Our process based on disciplined fundamental, valuation, technical price-trend analysis (FVTs) supports a continued recommendation to “hold your ground” at normal equity allocation targets as well as maintain a balanced blend of growth and value stocks. Should we be conservative in our expectations and instead experience a “market melt-up” to far higher levels than we predict this year, that would be a delightful problem. At least we know we have utilized our FVT work to message expectations of positive trend.
At that juncture, I am inclined to believe we would likely suggest some profit taking to rebalance back to normal long-term strategic targets if a blow-off top has taken clients’ stock exposure to higher-than-normal levels. I well remember Alan Greenspan’s warnings of “irrational exuberance” in December 1996. The market went on to hit higher highs for another three years after that warning. History and experience illustrate that valuation can stay on the higher side for some time if the fundamentals are still there. The idea of not getting too caught up in the frenzy, though, and rebalancing periodically back to normal allocations during that surge would have been prudent back then, in my mind—just as it would be in the near future if folks simply become too exuberant.
As always, thanks for your continued confidence and the opportunity to serve you.
Sources:
1-5FactSet
This commentary is provided for informational and educational purposes only. It is not intended to be personalized advice or a recommendation to buy or sell any security or engage in a particular investment or other strategy. Nothing herein should be relied upon as such, and there is no guarantee that any claims made will come to pass. Actual results or developments may differ materially from those projected. The information is deemed reliable, but we do not guarantee accuracy, timeliness, or completeness. It is provided “as is” without any express or implied warranties. Any opinions expressed are subject to change without notice and are not intended as investment advice or to predict future performance.
Asset allocation and rebalancing strategies can help manage risk within your portfolio, but they do not guarantee profits or protect against loss in declining markets. Investing involves risk and the potential to lose principal. Past performance does not guarantee future results. Please consult your financial professional before making any investment or financial decisions.
The indexes referenced herein are unmanaged and cannot be directly invested in. The S&P 500 Index is a market-cap weighted stock index constructed to track the share price performance of the top 500 large-cap U.S. equities. The S&P 500 Equal Weight Index is the equal-weight version of the S&P 500 index. The index includes the same constituents as the capitalization weighted S&P 500, but each company in the S&P 500 Equal Weight Index is allocated a fixed weight – or 0.2% of the index total at each quarterly rebalance.
Mariner is the marketing name for the financial services businesses of Mariner Wealth Advisors, LLC and its subsidiaries. Investment advisory services are provided through the brands Mariner Wealth, Mariner Independent, Mariner Institutional, Mariner Ultra, and Mariner Workplace, each of which is a business name of the registered investment advisory entities of Mariner. For additional information about each of the registered investment advisory entities of Mariner, including fees and services, please contact Mariner or refer to each entity’s Form ADV Part 2A, which is available on the Investment Adviser Public Disclosure website. Registration of an investment adviser does not imply a certain level of skill or training.