Expected Recession Is Tardy—What Gives?

Read time: 10 minutes
“The four most expensive words in the English language are, ‘This time it’s different.’” —John Templeton
Famous last words, or as most in the investment management and economic forecasting business realize, words that shouldn’t be used during serious conversations. As soon as we believe that “this time it’s different,” we eventually find that no, it isn’t different.
History seldom repeats itself, but it typically rhymes. The late Sir John Templeton, a natural optimist with a strong contrarian streak and one of the greatest investors of all time, suggested that these are “expensive” words for an investor to use. Wise words from a wise man.
Source: NoSpin FORECAST
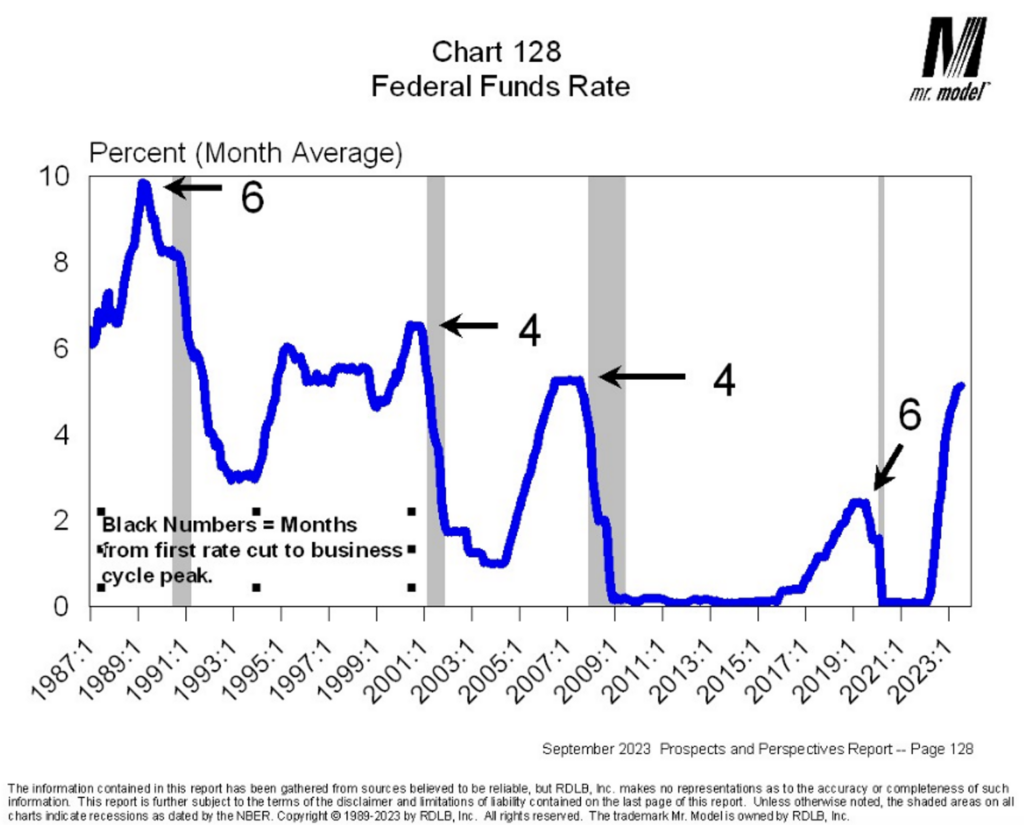
Some are suggesting we are far from an economic recession and that this time, the cycle is different and that the Federal Reserve has figured out how to manage a sustained soft landing (a tightening period that isn’t followed by a recession). It is true that we normally witness an economic contraction following the implementation of tightening Fed monetary policies.
According to my friend and former professional colleague, Dr. Robert Dieli (the author/owner of the NoSpin FORECAST), the Fed has failed at all attempts at a soft landing since 1966 to 1967. While I recently lowered the probability of an economic contraction occurring this year, I suggested the probability of the economy slipping into a light recession remains on the table for the next year or so. I stand by that view.
Bob sent me a federal funds rate chart, which shows federal funds rate decisions going back to 1987. The dark numbers embedded on the chart are the number of months a recession has started following the first rate decrease during the cycle. This historical perspective suggests that the Fed has normally recognized its mistake of tightening too much and reversing gears prior to the start of recessions over the last four cycles. A new wrinkle to ponder.
But so far, the expected recession is tardy. What gives? Our indicators (yield curve structure and Leading Economic Index (LEI) rate of change) have historically and reliably given us warnings of eventual economic weakness with a time lag that has been long and variable. For example, the time between a sustained yield curve inversion and a resulting recession has averaged 14 months over the last seven cycles. We entered a sustained inversion condition last summer. So, those who are now suggesting that this time it’s different need to keep this in mind.
Recession Tardy for Real Reasons
From a fundamental standpoint, why haven’t we entered a recession? If we identify the reasons, we can then make a judgment as to the sustainability of the factors that have kept an economic recession at bay so far.
Consumer Trends
I recently wrote on this issue and placed much of my reasoning for the “tardiness” of a recession on household savings balances that ballooned to very high levels during the COVID pandemic and economic lockdown year of 2020. Government largesse during that time (2020 to 2021, when government checks of significant amounts landed in most mailboxes) has helped lead to an extended business cycle. Is this factor sustainable? Let’s look at the evidence.
According to insightful data from the St. Louis Federal Reserve, household “excess” savings by consumers reached a whopping $2.3 trillion (savings balances relative to long-term trend) by the third quarter of 2021. Since that time, the excess savings calculation has declined by around $1.3 trillion as households have spent more than they have earned. The data from the Fed suggests households are still holding on to about $1 trillion in excess savings compared to normal periods. This should provide ammunition for the consumer to continue their recent spending patterns, at least for a period. This is one of the differences (government largesse) of this cycle as compared to previous business cycles.
Along with savings levels, we need to remember that a big piece of the extended consumption pattern is explained using revolving credit by consumers, which leads to credit card debt. According to data provided by the Fed, consumers’ use of revolving credit has increased by 16.1% over the last 12 months and is now hitting the highest levels in history. Since the second quarter of 2021, revolving credit use has grown by 29.6%, or about 15% per year, as compared to the normal long-term growth rate of 3.5%.
Another factor that has helped consumption patterns remain reasonably strong is that many consumers have locked in very low mortgage interest rates. According to CoreLogic, a full 80% of outstanding mortgage interest rates are at 5% or lower. Data from the Fed shows the average 30-year mortgage rate has been 7.74% (1970 to 2023). Consumers have been active in locking in very low interest rates, keeping monthly payments low for mortgages. The result is that many consumers have more discretionary spending power than would otherwise be the case.
So, along with high savings balances, which are deteriorating, revolving credit use, which is growing, and mortgage refinancing, consumers have felt flush with money over the last couple of years, which has kept the economy from falling into a recession.
Consumption has been so strong since the end of 2020 that the growth in personal consumption expenditures has, on average, accounted for 88% of overall gross domestic product growth since that period as compared to historical averages of around 70%.1 The consumer has indeed been in charge.
What of Business?
What have businesses been doing to contribute to the economy staying out of recession? Why have most businesses not fallen into tough times because of tightening monetary policies? According to an August 29 article in Barron’s magazine by Stephen Dover, the head of the Franklin Templeton Institute, businesses, along with consumers, have also been taking advantage of low interest rates. Per the noted article:
“Let’s take the commercial paper market. Outstanding commercial paper (short-term borrowings) market is currently about $1.2 trillion in size as compared to $2.2 trillion in 2007 (prior to the financial meltdown). Over the same period, U.S. investment grade and U.S. high yield debt markets mushroomed from $2.1 trillion to $7.8 trillion, and from $700 billion to $1.2 trillion, respectively. At the same time, global private credit has grown by $1 trillion.
“Most of these borrowings are at fixed rates rather than variable rates applied in the commercial paper market. So as the Fed raises short-term interest rates, the effect on overall business profitability is muted as compared to previous cycles.
“But that is not the total picture for the Fed’s rate increase on businesses’ bottom lines. We need to understand that as the yield curve remains inverted, many businesses are reporting higher levels of income from their cash-on-hand balances due to higher short-term interest rates. So many businesses are experiencing higher short-term rates of return on cash, while paying lower interest expenses due to their locking in low interest rates on their long-term debt structure.”
The corporate sector of the economy seems more resilient to Fed rate tightening effects than has been the case during previous cycles, partially due to debt maturity extensions and moving debt away from the commercial banking system, effectively blunting some of the impact of Fed policies. But over the long term, new borrowings will be required, either because of business growth or for refinancing of existing debt. While different, business’s debt restructuring hasn’t eliminated the business cycle only delayed the probable impacts.
Income Statement vs. Balance Sheet
All that has been covered is centered on the cost of capital relative to GDP, both being income statement items. What about the nation’s balance sheet? I have long held the view that income statement health drives profitability and overall growth (GDP). Strong balance sheets drive sustainability of economic activity through financial strength.
From a private sector basis, income statements drive stock prices and family incomes. Balance sheets determine the ability to survive and stay in business. From a macroeconomic standpoint, much of the activity we have seen over the last few years can be classified as a simple creation of massive levels of debt, much of which was used to bolster the nation’s “income statement.” This is particularly true for the government’s ledger.
Federal government debt outstanding ballooned by 43%2 over the last four years. Below is macro data on debt levels of all segments of our national economy.
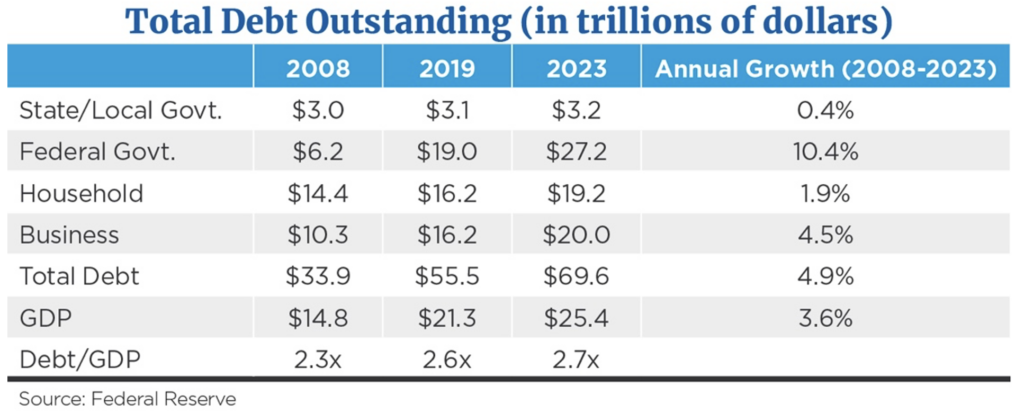
Looking at the data above, it becomes apparent that as the nation has built debt risk, that increased risk resides primarily in the government debt market. As the nation’s economy grew by an average of 3.6% (nominal) over the last 15 years, federal government debt soared by an average of more than 10% per year.
Federal government debt now exceeds both household and business debt by a wide margin. As half of that debt matures over the next six years, we could see financial stresses negatively impact the exchange rate of the dollar along with what interest rates the world’s investors may demand from the government for further debt issuance. Reflecting the increased leverage and the dysfunction present in Washington, two of three rating agencies have now cut the government’s credit rating.
The best news I can highlight from the table above is the fact that the entire U.S. economy (business, consumer and government, combined) isn’t all that much more levered than has historically been the case in relation to overall GDP levels. We certainly can’t thank the government for that condition. As a sidebar item, federal government debt levels have grown dramatically over the last 15 years, regardless of who was in office.
Summary and Conclusions
The theme of this commentary outlines why the economic cycle seems extended by historical standards. Going back in time, we see the average lead time between a sustained yield curve inversion and a recession has averaged 14 months. According to Dr. Bob Dieli, we normally see the Fed reduce the fed funds rate prior to the economy falling into a contraction. During this economic cycle, the yield curve inverted on a sustained basis during the summer of 2022. Putting all this together, I don’t think we will see a recession start this year.
But that doesn’t mean a recession may not be forthcoming in 2024. However, the data above points to the recession being softer and not as vicious as was the case in the 2008 to 2010 downturn, as it highlights the view that the nation’s income statement has bought time at the expense of the country’s overall balance sheet.
Therein lies an apparent real risk for the economy going forward—a government that has strengthened national GDP by the issuance of more than $8 trillion in new debt since the beginning of the pandemic year of 2020.3 Will the government slow its debt issuance level? With next year being an election year, politicians of all stripes know their chances of reelection are hurt if the economy falls into an economic funk prior to Election Day.
The first rule of “hole management” is to stop digging if you want to get out of the hole. I don’t believe the government will stop digging prior to the 2024 election. While it is too early to make a formal call for 2024, the year may prove to be interesting.
Footnotes
1 St. Louis Federal Reserve
2, 3Federal Reserve
This commentary is provided for informational and educational purposes only and does not consider individual personal, financial, legal, or tax considerations. The information contained herein is not intended to be personal legal, investment, or tax advice or a solicitation to buy or sell any security or engage in a particular investment or other strategy. Nothing herein should be relied upon as such, and there is no guarantee that any claims made will come to pass.
Any opinions or forecasts contained herein are based on information and sources deemed reliable, but we do not warrant the accuracy of the information. You should note that the materials are provided “as is” without expressed or implied warranties.
Opinions expressed are subject to change without notice and are not intended as investment advice or to predict future performance.
Investing involves risk and the potential to lose principal. Past performance does not guarantee future results.
This information is not a substitute for specific individualized tax, legal, financial, or investment planning advice. Where specific advice is necessary or appropriate, we recommend that you consult with a qualified professional.
The Leading Economic Index (LEI) consists of 10 components that indicate the short-term future course of various sectors of the economy, combined into a composite indicator of general economic performance.
Mariner is the marketing name for the financial services businesses of Mariner Wealth Advisors, LLC and its subsidiaries. Investment advisory services are provided through the brands Mariner Wealth, Mariner Independent, Mariner Institutional, Mariner Ultra, and Mariner Workplace, each of which is a business name of the registered investment advisory entities of Mariner. For additional information about each of the registered investment advisory entities of Mariner, including fees and services, please contact Mariner or refer to each entity’s Form ADV Part 2A, which is available on the Investment Adviser Public Disclosure website. Registration of an investment adviser does not imply a certain level of skill or training.