Déjà Vu starting to play out

Read time: 7 minutes
“Deja Vu confirms a faithful path worth taking.”
– T.F. Hodge
Folks familiar with me know I like to use themes when discussing my economic and capital market views. I tend to view the economy (and much else in life) in a historical context. Why? Just because this is a new year doesn’t mean we as people have radically changed our habits and processes. We all learn from our own and other’s pasts. That’s why thematic thought processes make sense to me.
Last year’s core economic theme was “3 Yards and a Cloud of Dust,” which attempted to conjure up in your mind a view of slow growth accompanied by a lot of noise. We got the slow growth for the first six months of the year, and we saw plenty of noise all year long.
This year’s theme, which I outlined earlier is “Déjà vu”—an environment which seems familiar but not in the front of our minds. It’s an environment which we may have seen sometime in the past. I’m suggesting we have come into an environment where GDP growth will be closer to 3% in the year, as will inflation, which leads us to an environment where “nominal” GDP growth should be around 6%.
To put this in perspective, nominal GDP growth has averaged 4.8% per year over the last 35 years.1 So my theme of “Déjà vu” is probably operative if you experienced what our economy was like in the period prior to the start of the millennium. A period of déjà vu: we have seen this before but not recently.
We’ve received a head start on this thinking with economic data released recently that leads me to the view that our déjà vu call is starting to work.
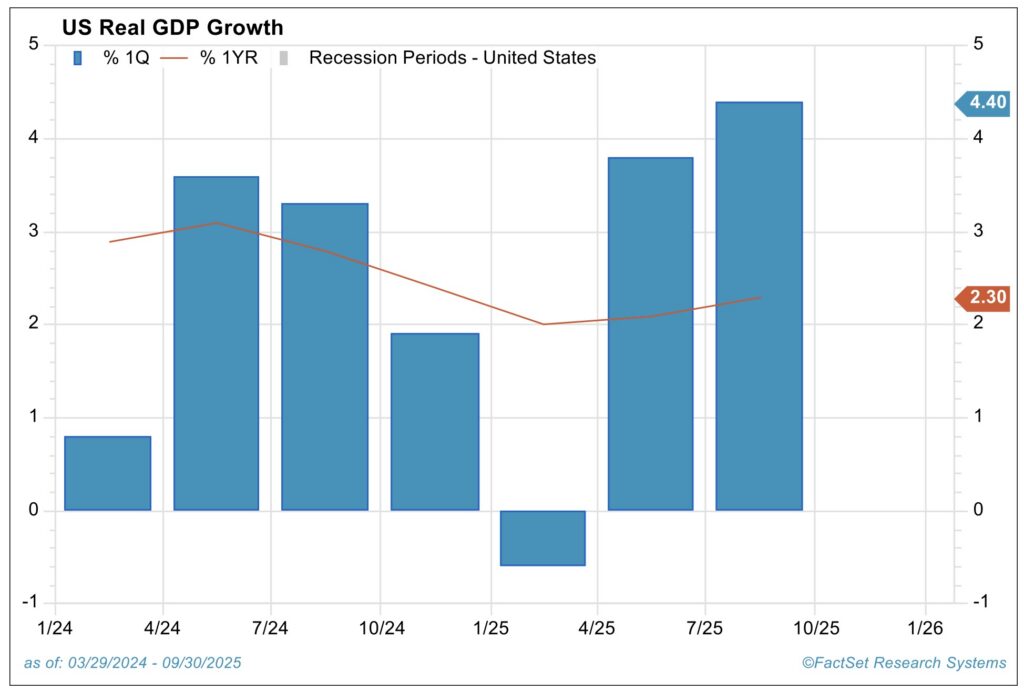
Recently, the Bureau of Economic Analysis (BEA) released a report covering economic activity during the third quarter of last year. According to the report, the U.S. economy grew by a strong 4.4% on an annualized basis in the third quarter of 2025. Add that to the two previous quarters and it gives us a view that, on an annual basis, the economy grew at an average rate of 2.5% during the first nine months of 2025.2
As of the end of January, the Atlanta Fed’s GDPNow modeling is suggesting that fourth quarter real GDP may have grown in the neighborhood of 4.2%.3 If that estimate holds, 2025 real GDP growth will go down in the record books at a 3.0% average, in-line with the “Déjà vu” theme.
If we look back in time and exclude the 2021 pandemic-rebound GDP growth rate of 6.2%, we haven’t seen this level of GDP growth for 20 years—since 2005, when the economy grew by 3.5%.1 And yes, that includes the economic rebound coming out of the Great Recession of 2007 to 2009!
The GDP growth release is broken down with data below:
| 3rd quarter release | Previous 4-quarter average release | |
| Real GDP – annualized | 4.4% | 2.1% |
| Personal consumption | 3.5% | 2.7% |
| Investment spending | 0.0% | 0.9% |
| Trade impact | 5.2% | 1.6% |
| Government investment | 2.2% | 1.9% |
*Data sourced from the Bureau of Economic Analysis as of 01/30/2025
As noted, the impact from net export activity (trade) added a strong element of growth during the third quarter. Trade activity was also a major contributor to the overall growth rate for the preceding 4-quarter growth rate.
This basically shows that export growth has been stronger than import growth. I hope the driver of this change is a rebound in foreign economic activity. As a side note, inventories had little impact one way or the other during the third quarter.
What about investment spending? Some are surprised that investment spending isn’t driving real GDP growth upwards, with spending increasing due to the AI buildout. Below is the breakdown of various types of investment spending for the third quarter as compared to the previous 4-quarter period.
| 3rd quarter release | Previous 4-quarter average release | |
| Investment spending | +0.0% | +0.9% |
| Structures | -5.0% | -5.2% |
| Intellectual properties | +5.6% | +5.8% |
| Residential | -7.1% | -1.7% |
*Data sourced from the Bureau of Economic Analysis as of 01/30/2025
A significant decline in residential investment spending occurred during the third quarter of 2025, which was possibly affected by higher mortgage interest rates. Also note the commercial “structures” spending category, which has been rather weak for some period. So, over the last three quarters, much of the spending on AI activity seems to have been offset by weakness in structures and residential spending.
Core Personal Consumption Expenditure
The Core Personal Consumption Expenditure (PCE) price index, which is the Fed’s favorite measure of inflation pressure, was also recently released for the month of November. Over the previous 12-month period, the PCE was up 2.8%.4 What does this look like in relation to the Fed’s expectation? According to the latest Fed’s Summary of Economic Projections data (12/10/25), the Fed is expecting Core PCE inflation of 3.0% for 2025, falling to 2.5% in 2026.5
But the Fed is also looking for “real” GDP growth of 1.7% this year, rising to a growth rate of 2.3% in 2026.5 I suspect we’ll probably see both economic growth and inflation hotter than the Fed’s current view for next year. If so, bond market Fed watchers may be disappointed in the Fed not willing to lower rates next year.
Nominal GDP in Rarified Territory
If we add the inflation data in with the released GDP data, we see that nominal GDP growth was 6.0%. I like to think of nominal GDP is the top line, or sales level of the economy, similar to that of a domestic company. The nominal data includes unit volume growth (real GDP) and product pricing (inflation effect).
A question comes to mind: What has been the average nominal GDP growth rate over a longer period? The average nominal GDP growth rate our economy has experienced since 1990 was 4.8%.1 So, 6% growth is truly exceptional, particularly in relation to recent experience. In contrast, nominal GDP growth averaged 8.4% from 1960 to 1989.1 I suggest nominal GDP growth in 2026 may truly be a déjà vu experience.
Corporate Profit Historical Track Record
How have U.S. corporate profits faired during previous periods when nominal GDP growth has been 6% or higher (our target nominal GDP growth expectation for 2026)? If we go back to 1980 (46 years) we find that nominal GDP growth has been 6% or higher on 17 occasions, for a batting average of .360. So, 6% nominal GDP growth rates haven’t been totally odd, but unlikely.6
Over those 17 years, corporate profit growth rates have averaged 13.3%, much higher than normal growth. Something else of note: Of those 17 years, only 2 years showed negative earnings growth rates, a batting average of .117. Over the study period, reported corporate earnings declined 11 of the 46 years for a batting average of .239.6 The probability of experiencing an earnings contraction in a year where nominal GDP growth was at 6% or higher was less than half the probability of any one year’s earnings growth being negative. So, earnings growth has been both stronger in the 6% GDP growth years as well as being more predictable.
Last Word
I’ve been suggesting a 70% probability that the U.S. real GDP growth will be 3% in 2026. Additionally, I’ve suggested that core PCE inflation will run close to 3% this year as well.
That leaves 30% probability that nominal GDP growth will be lower than 6%; this includes the outside chance of seeing a recession unfold this year. But it seems the chance of that occurring is diminishing.
Sources:
1Source: Data sourced from the Bureau of Economic Analysis as of 12/31/2025.
2Source: Bureau of Economic Analysis. https://www.bea.gov/news/2026/gross-domestic-product-3rd-quarter-2025-updated-estimate-gdp-industry-and-corporate
3Source: Federal Reserve Bank of Atlanta, GDPNow. As of February 2, 2026. https://www.atlantafed.org/cqer/research/gdpnow
4Source: Bureau of Economic Analysis. https://www.bea.gov/news/2026/personal-income-and-outlays-october-and-november-2025
5Source: Federal Reserve Board, Summary of Economic Projections on 12/10/2025. https://www.federalreserve.gov/monetarypolicy/files/fomcprojtabl20251210.pdf
6Source: St. Louis Federal Reserve and NYU Stern School of Business
This commentary is provided for informational and educational purposes only. As such, the information contained herein is not intended and should not be construed as individualized advice or recommendation of any kind.
The opinions and forward-looking statements expressed herein are not guarantees of any future performance and actual results or developments may differ materially from those projected. The information provided herein is believed to be reliable, but we do not guarantee accuracy, timeliness, or completeness. It is provided “as is” without any express or implied warranties.
There is no assurance that any investment, plan, or strategy will be successful. Investing involves risk, including the possible loss of principal. Past performance does not guarantee future results, and nothing herein should be interpreted as an indication of future performance. Please consult your financial professional before making any investment or financial decisions.
Mariner is the marketing name for the financial services businesses of Mariner Wealth Advisors, LLC and its subsidiaries. Investment advisory services are provided through the brands Mariner Wealth, Mariner Independent, Mariner Institutional, Mariner Ultra, and Mariner Workplace, each of which is a business name of the registered investment advisory entities of Mariner. For additional information about each of the registered investment advisory entities of Mariner, including fees and services, please contact Mariner or refer to each entity’s Form ADV Part 2A, which is available on the Investment Adviser Public Disclosure website. Registration of an investment adviser does not imply a certain level of skill or training.