Decent Q4 makes it three straight years of double-digit returns. How about four in a row?

We wouldn’t call it a scorching Santa Claus rally, but the S&P 500 was able to hang on and post a positive total return of roughly 2.7% in Q4 2025. This put a nice cherry on top of another solid year for US equity investors. In calendar 2025, the S&P 500 recorded a gain of 17.9% to make it three consecutive years of double-digit returns. When coupled with gains of over 25% each in both 2023 and 2024, the S&P 500 has returned more than 86% from its close on December 31, 2022.1 That is a WOW! This is a relatively rare occurrence.
Over the S&P 500’s nearly 95-year history, there have been only five distinct periods in which the index delivered double-digit price returns (greater than 10%) for three or more consecutive years—and just four such streaks since 1949.2 Since I was born and raised in Northern Kentucky, I’d like to put this S&P 500 accomplishment in perspective by comparing it to some long-standing historical horse racing statistics. In the last 100 years, there have been 12 Triple Crown winners, and only five over that same post-1949 period. My point? Triple threats are even rarer for equity investors than they are for elite competitive equestrians.3
So, what are the odds of a four-years-in-a-row result for the S&P 500 in 2026? Despite the fact that four straight has happened only three times in the last 95 years, we think the odds are fairly high that this occurs in 2026. Our base-case forecast for the S&P price level at year-end 2026 is 7,700, which would indeed make this a reality.
Our constructive view on 2026 is grounded in many of the same factors that shaped our favorable outlook entering 2025—fundamental, valuation and technical metrics (what we refer to as the F, V and T’s)—which form the foundation of our research and analysis and continue to tilt positive.
Avid readers of our investment commentary are well aware of our 2025 thesis of Clear Air Turbulence, which anticipated a very profitable calendar-year result and a “safe landing” for equity returns, albeit with several significant “air pockets,” or temporary pullbacks, before returning to pleasant blue-sky altitudes. We’re gratified that there could not have been a clearer description of what occurred last year.
We placed 70% odds on the S&P 500 closing the year in a price range of 6,600–7,000. The close of 6845 on Dec. 31, 2025, fell squarely in the middle of that range.
As expected, however, wall-of-worry items—including concerns over the impacts of dramatic shifts in tariff policy, a labor market slowdown, speculation around Federal Reserve rate decisions, government shutdown drama, warnings of a brewing AI “bubble” and affordability pressures that disproportionately affect lower-end consumers—drove several meaningful pullbacks during the year. These air-pocket moments were punctuated by the roughly 20% correction in the spring associated with looming April “Liberation Day” tariff announcements.
The market was able to climb this large list of headline issues via the solid F, V, T’s and related pillars of support, including solid earnings, steady economic growth, cooling inflation and stable longer-term inflation expectations, as well as a measured Federal Reserve. The economy continues to be driven by a very healthy high-end consumer and strikingly robust levels of business capital spending, as illustrated by the surprisingly strong 4.3% real GDP growth recorded in the third quarter of 20254 and upwardly revised expected forward earnings growth of roughly 15%.5
Crystal Ball teaser and outlook for 2026
While we look forward to economic expansion and solid earnings growth in 2026, investors must first weather a short softening patch in economic activity associated with the impacts of a government shutdown as fourth-quarter data is released. This period must be absorbed before we see the positive catalysts of a shutdown resolution, massive first-quarter 2026 tax refunds, continued strong capital spending by businesses and stimulus from events such as the semiquincentennial and World Cup games in the U.S., all of which are coming in 2026.
In fact, the impact of the expected roughly $100 billion in additional consumer spending fueled by large tax refunds and $100 billion in incremental capital spending in 2026 alone should add nearly 70 basis points to GDP growth in 2026 versus 2025.
Like the Federal Reserve, which upwardly revised its 2026 real GDP growth forecast by 50 basis points in its latest Summary of Economic Projections—an infrequently noted fact—we at Mariner also expect stronger real GDP growth in 2026 than we saw in 2025.
We will shortly be introducing our thesis of 2026—The Year of Risk Awareness and Diversification 2.0. We will articulate a narrative in which themes of diversification, balance and thoughtful risk management take on even greater relevance this year.
One of the return patterns that caught our eye in the final months of 2025 was the broadening of market leadership and the expansion of sectors contributing to returns. For example, S&P 500 sectors such as health care, industrials and financials posted solid returns and surpassed those of information technology in the final innings of 2025. In these closing moments, it was not just all about technology stocks.
Similarly, the more diversified equal-weighted S&P 500 index hit new highs toward year-end, as did the small-cap-oriented Russell 2000. Further, while the S&P 500 performed well last year, international equities and some alternative asset classes performed even better. Specifically, while the S&P 500 advanced 17.9 in 2025, developed-country international stocks, which populate the MSCI EAFE Index, returned a total of 32%, and emerging market international stocks contained in the MSCI EM Index returned 34%. Gold trumped them all, rising 56% in price over the year.
Despite the fact that we expect 2026 to be a fourth year in a row in which the S&P 500 achieves a return greater than 10%, we also believe 2026 will be a year in which diversification and balance become increasingly important, as investors continue to recognize that the market-cap-weighted S&P 500 carries inherent concentration risks and is not the only game in town.
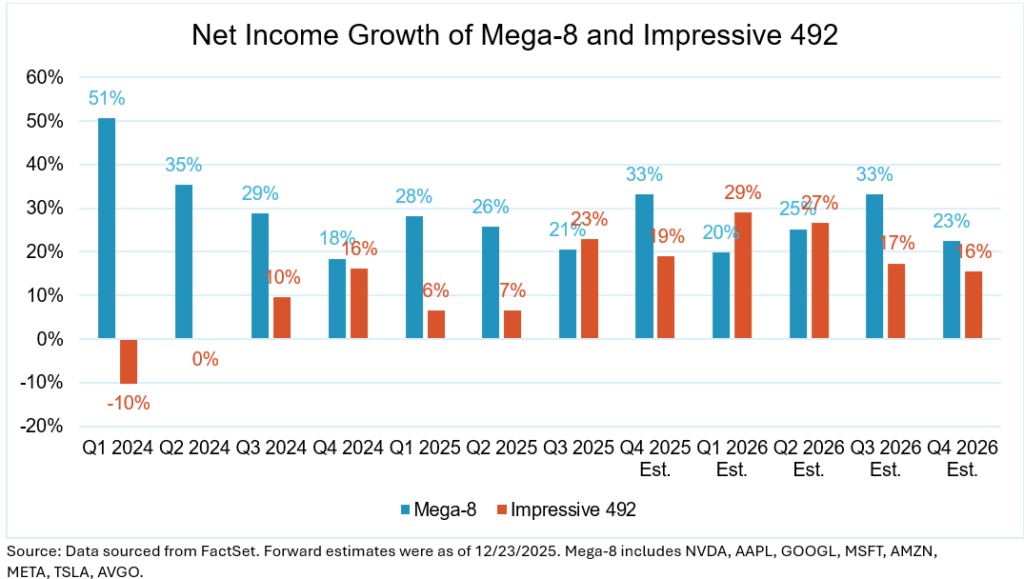
Balance should be a priority for achieving the best results this year. That includes balance within S&P 500 sectors and individual stocks owned (as the earnings growth advantage of the Magnificent Seven versus the other 493 narrows), balance between growth and value in domestic equity exposure and proper balance across the various equity asset classes held.
Valuation perspective – elevated but justifiable and not a bubble!
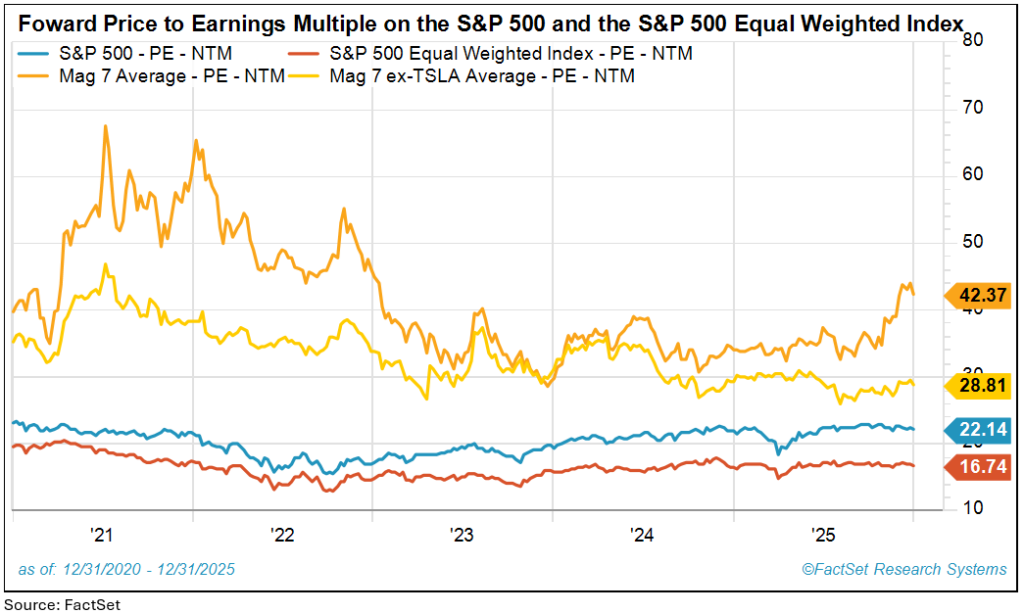
The valuation backdrop remains largely unchanged, with the S&P 500 trading at roughly 22x forward earnings at year-end—about where it began the year and approximately where it has traded for several years. Returns this year have been driven by earnings growth, not multiple expansion. Why are valuation concerns suddenly front and center? We don’t understand it.
Further, while the current P/E level appears elevated when viewed against long-term averages, it is justified by the data. Today’s market structure—with stronger profitability, higher margins and more asset-light, high-ROE companies—supports these higher multiples. Meanwhile, the equal-weighted S&P 500 trades near a much more reasonable 17x, where investors can still find plenty of attractive opportunities backed by solid earnings growth expectations.
In this environment, selectivity matters, and knowing exactly what you own becomes increasingly important. Finally, valuation simply is not an effective market-timing tool when used in isolation. That is why we evaluate the likely direction of the market through three lenses: fundamentals, valuation levels and technicals.
On the valuation front, we would grow more concerned if enthusiasm around additional Fed cuts sparked a melt-up that pushed valuations meaningfully higher—for example, above 24 times earnings—at a time when fundamentals and technical price trends were deteriorating. And perching at the higher end of the P/E valuation range does make the market more vulnerable to temporary pullbacks should a monthly economic report disappoint or should investors begin to fret, even briefly, about politics in a midterm election year. But at current levels, staying diversified, disciplined and focused on fundamentals remains the prudent way to manage this risk, as opposed to reducing equity exposure.
The 2026 wall of worry remains substantial—consumer resilience, Fed policy, AI bubble chatter and midterm elections. But the market should continue its climb.
The market’s wall of worry remains centered on the health of the consumer and labor market, ongoing Fed policy uncertainty and a growing chorus of AI bubble concerns. Midterm election angst will also surface as we move through the year.
On the consumer and labor front, while pockets of weakness have emerged—particularly among lower-income households—we continue to see a broadly healthy consumer, supported by solid wage growth, still-low household debt service ratios and delinquencies that, while rising modestly, remain below long-term averages. Despite headline layoffs, the labor market is not unraveling. Hiring has slowed as expected after an extended period of tight conditions, but unemployment remains historically low and firings are not elevated in aggregate. New weekly unemployment claims remain near record-low levels.
While many market watchers seem unable to resist obsessing over and speculating about Fed policy, from our perspective the Fed remains on a sound course. The central bank has been measured and data-driven, cutting rates without reigniting inflation and striking an appropriate balance between supporting growth and maintaining price stability.
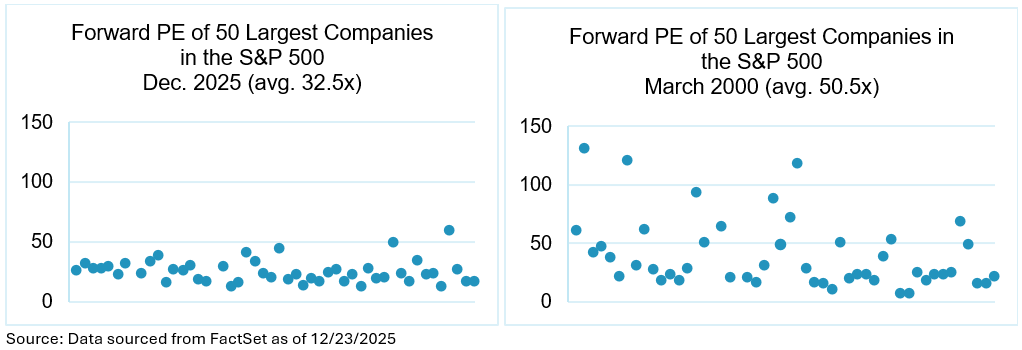
In technology, the AI “bubble” chatter has no doubt grown louder; however, we view much of this concern as premature. Today’s AI-related investment is being funded by profits and cash flow—not speculation—and is tied to real demand for productivity gains, making it very different from prior tech bubbles. The chart below illustrates that current conditions are not comparable to those seen in 2000.
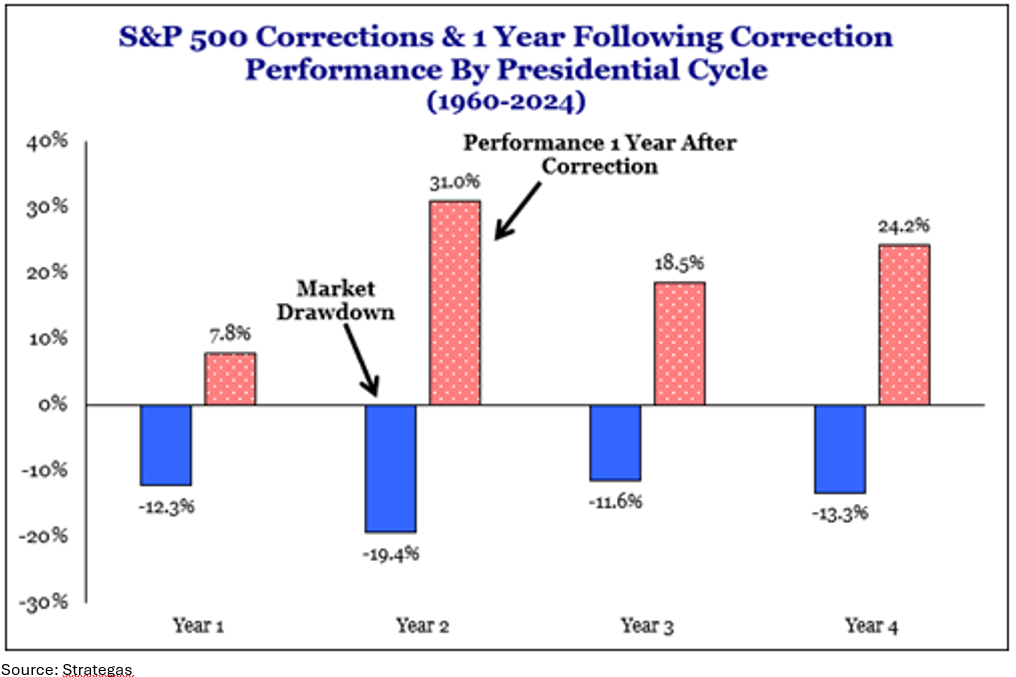
Regarding midterms, temporary drawdowns are typically slightly greater than in nonelection years, but they generally usher in gridlock that has historically boded well for the market. The chart below illustrates the strong historical performance in the 12 months following past midterm elections.
As always, we will monitor these wall of worry items closely and watch for any signs they are beginning to bleed into the fundamental data, but at present they remain headline risks, not fundamental breaks.
Wrap-up
Please join us for our 2026 Crystal Ball presentation, where we will cover our constructive base-case outlook and assumptions, as well as discuss alternative, less likely optimistic and pessimistic scenarios that could develop should the data underlying our assumptions evolve in a brighter or darker direction.
Wishing all a happy New Year!
Sources:
- FactSet
- FactSet
- Kentucky Derby https://www.kentuckyderby.com/triple-crown/
- Bureau of Economic Analysis, Gross Domestic Product, 3rd Quarter 2025 (Initial Estimate) and Corporate Profits (Preliminary) | U.S. Bureau of Economic Analysis (BEA)
- FactSet Consensus Earnings Estimates as of 12/29/2025
This material is provided for informational and educational purposes only and is not intended to be, and should not be construed as, individualized investment advice, a recommendation, or a solicitation to buy or sell any security or adopt any investment strategy. Investors should consider their individual circumstances and consult with a financial professional before making investment decisions.
This commentary includes forward-looking statements and expectations regarding market conditions, economic growth, valuation levels, and index performance. Such statements reflect current views and assumptions as of the date indicated, are inherently uncertain, and are subject to change without notice. Actual results may differ materially, and there is no assurance that any forecast, expectation, or projected outcome will be achieved. References to probabilities or “base-case” scenarios represent opinions, not guarantees. Any references to probabilities, odds, expectations, or base-case scenarios represent the author’s opinions, not guarantees or statistical probabilities, and should not be relied upon as predictions of future market performance.
The views expressed are based on assumptions regarding economic conditions, monetary and fiscal policy, corporate earnings, and other market factors that may not develop as anticipated. Changes in market conditions, policy decisions, geopolitical events, or other factors may materially affect outcomes. Periods of market appreciation may be followed by increased volatility, corrections, or declines. Diversification and asset allocation strategies do not ensure a profit or protect against loss.
Historical performance, market patterns, comparisons, and analogies are provided for informational and illustrative purposes only. Past performance, including historical market trends or periods of consecutive positive returns, does not guarantee future results and may not be repeated.
Equity securities are subject to price fluctuation and investments made in small and mid-cap companies generally involve a higher degree of risk and volatility than investments in large-cap companies. International securities are generally subject to increased risks, including currency fluctuations and social, economic, and political uncertainties, which could increase volatility. These risks are magnified in emerging markets.
Fixed-income securities are subject to loss of principal during periods of rising interest rates and are subject to various other risks including changes in credit quality, market valuations, liquidity, prepayments, early redemption, corporate events, tax ramifications, and other factors before investing. Interest rates and bond prices tend to move in opposite directions. When interest rates fall, bond prices typically rise, and conversely, when interest rates rise, bond prices typically fall.
There is no assurance that any investment, plan, or strategy will be successful. Investing involves risk, including the possible loss of principal.
References to market indexes, index returns, valuation metrics, or projected index levels are not intended to reflect the performance of any specific investment or investment strategy. Indexes are unmanaged, do not include the deduction of fees or expenses, and cannot be invested in directly. Forecasts or expectations related to index performance are not indicative of future results.
For index definitions visit https://www.marinerwealthadvisors.com/index-definitions/. Mag 7 stocks refer to Alphabet, Amazon, Apple, Meta, Microsoft, Nvidia and Tesla.
Mariner is the marketing name for the financial services businesses of Mariner Wealth Advisors, LLC and its subsidiaries. Investment advisory services are provided through the brands Mariner Wealth, Mariner Independent, Mariner Institutional, Mariner Ultra, and Mariner Workplace, each of which is a business name of the registered investment advisory entities of Mariner. For additional information about each of the registered investment advisory entities of Mariner, including fees and services, please contact Mariner or refer to each entity’s Form ADV Part 2A, which is available on the Investment Adviser Public Disclosure website. Registration of an investment adviser does not imply a certain level of skill or training.