Volatility returns as global risks rise

Read time: 8 minutes
The S&P 500 finished the month of March down 5.0%, bringing year-to-date losses to 4.3%. There were very few places to hide, as 10-year Treasury yields rose from 3.96% to 4.32%, gold declined 11%, and international equities underperformed their domestic counterparts. From a sector standpoint, energy was the only sector to finish the month with positive returns.1
As is often the case in periods like this, there were both positives and negatives to take away. The strikes in Iran understandably dominated headlines and contributed to elevated uncertainty. On the positive side, valuations have improved following the pullback, and earnings growth remains healthy. On the risk front, we are increasingly mindful of the uptick in credit spreads. While not yet at alarming levels, they are trending wider and warrant attention.
Additionally, Fed policy no longer appears to be a clear tailwind, as renewed inflation concerns have pushed expectations for rate cuts further out.
Geopolitics and volatility: Context matters
Geopolitical conflicts have historically sparked short-term volatility, but markets have consistently shown an ability to refocus on fundamentals over time. While military events and crises can trigger sharp, headline-driven selloffs, equity markets have demonstrated notable resilience over medium- and longer-term horizons.
Across a range of historical episodes, from global conflicts to regional tensions and terrorist attacks, markets have often recovered and moved higher once initial uncertainty begins to fade and investors re-anchor to earnings growth, economic conditions and valuations.
Importantly, sector behavior during these periods is often less predictable than commonly assumed. Investors do not uniformly rotate into traditional “defensive” areas; instead, capital tends to flow toward companies and sectors with stronger earnings visibility and more attractive relative valuations. This perspective does not diminish the seriousness or human cost of geopolitical events, but it reinforces that markets have a long track record of climbing the wall of worry once clarity begins to emerge.
From a volatility standpoint, the broader backdrop also matters. Mid-term election years have historically been more volatile, with average intra-year pullbacks of roughly 19%, compared to 12–13% in other years of the cycle.2 The current conflict is likely to add to that volatility. However, increased volatility is not synonymous with a sustained bear market, particularly when underlying fundamentals remain intact.
Disruption in the Strait of Hormuz remains a real and important risk, with the potential to spill over into broader economic data through higher energy prices and tighter financial conditions. The longer this conflict persists, the greater the likelihood that such risks move from theoretical to tangible.
Fed, rates and financial conditions
One notable shift this month has been the change in the Fed’s role in supporting markets. Earlier in the year, expectations for rate cuts provided a meaningful tailwind. Today, that dynamic has shifted. Inflation concerns have re-emerged, pushing rate-cut expectations further into the future and contributing to higher yields.
This shift has tightened financial conditions at the margin. Rising yields and widening credit spreads are not yet flashing warning signs, but they do represent a change in tone. Markets are now navigating an environment where monetary policy is less supportive and more data-dependent, reinforcing the need for selectivity and discipline.
We felt it was likely that the Fed would employ anything from zero cuts to up to two cuts this year, depending on how the data on employment trends and inflation evolves, given their dual mandate to monitor emerging trends in both.
With solid economic growth and earnings metrics holding firm going into this conflict, the potential inflation impacts from rising oil prices post-initiation of war may lead to stickier inflation data and leave the Fed on pause for a while. This may result in our zero-cut scenario…though clearly a Fed on hold was part of our range and base case outlook for monetary policy.
Further, we find it comforting that since the U.S. central bank, unlike its foreign central bank brethren, does indeed have a dual mandate (foreign central bankers have a single mandate of focusing solely on price stability), the U.S. Fed stands ready to cut should the signs of recession begin to develop. This is an advantage versus other global central banks.
Interestingly, treasury yields in the U.S. have already begun to rise a bit, post conflict initiation and market forces have in essence started to do the job of inflation fighting for them, allowing the Fed more flexibility to cut if economic growth flags significantly.
Market structure: Dispersion returns
Despite the broad-based decline at the index level, what’s happening beneath the surface is equally important. March reinforced a key theme we outlined at the start of the year: dispersion is back.
Returns are becoming less concentrated, both across sectors and within the index itself. This is consistent with our Risk Awareness and Diversification 2.0 (RAD) framework. Markets are no longer being driven by a narrow group of leaders. Instead, we’re seeing a more dynamic environment where outcomes vary widely across companies, sectors and asset classes.
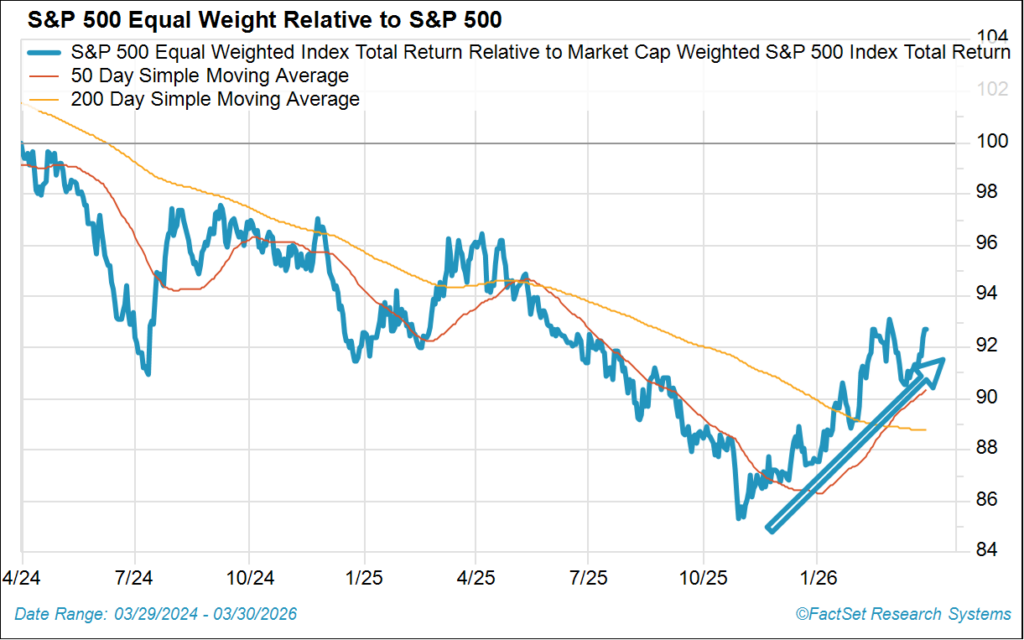
The below chart shows the continued outperformance of the S&P 500 equal weighted index versus the traditional capitalization weighted S&P 500.
That shift creates both challenges and opportunities. Volatility may be higher, but so is the potential for active decision-making to add value. In many ways, this is the type of environment where diversification matters more, not less.
RAD: Positioning for a broader market
Our theme for 2026, Risk Awareness and Diversification 2.0 (RAD), is playing out as expected. The current environment reinforces the need to remain balanced and risk aware, resisting the urge to aggressively buy dips or reduce exposure below neutral levels. In our view, this is an ideal backdrop for active management, where selectivity and disciplined positioning can add meaningful value.
RAD is not about becoming defensive or reducing exposure to equities. It’s about recognizing that leadership is broadening and that concentration risk matters more in this phase of the cycle. Investors should be mindful of where returns are coming from and ensure portfolios are positioned to benefit from a wider opportunity set.
We continue to see opportunities across market caps, sectors and geographies, even as volatility persists. The key is balance, maintaining exposure to growth while ensuring diversification across other areas that can contribute to returns.
Conclusion
We maintain our 7,700 base case target for the S&P 500. While the path may be more volatile than in recent years, we continue to believe that earnings growth will be the primary driver of returns, not speculation or multiple expansion. We acknowledge the probabilities of achieving our optimistic case (8,100) have fallen and increased odds of the disappointing case (6,900) seem prudent, but the base case seems to be most probable.3
Importantly, the recent pullback has helped improve valuations and reset expectations. At the same time, the return of dispersion and broader participation supports the case for a more durable and sustainable advance over time.
All of this reinforces our RAD framework. This is a market where risk awareness, diversification and discipline are critical. Volatility driven by headlines may persist, but the underlying fundamentals—earnings, economic growth and market structure—remain intact.
In short, while March was challenging, it does not change our broader view. The environment is evolving, not deteriorating. And for investors who remain balanced and focused on the fundamentals, the opportunity set remains compelling.
Sources:
1Returns sourced from FactSet
2Strategas
3Market-level targets referenced herein are based on valuation assumptions (including price-to-earnings multiples), forward 12-month consensus earnings estimates and scenario analysis. The price return is determined using a starting level of 6,845, the closing price for the S&P 500 on Dec. 31, 2025, and total return incorporates the impact of dividends. A flat 1% dividend yield is assumed, and actual dividend yields will vary. Consensus earnings projections are based on information obtained from FactSet. Scenario outcomes and any associated likelihoods are subjective, do not represent precise probabilities, and are subject to change.
This commentary is provided for informational and educational purposes only. As such, the information contained herein is not intended and should not be construed as individualized advice or recommendation of any kind.
The opinions and forward-looking statements expressed herein are not guarantees of any future performance and actual results or developments may differ materially from those projected. The information provided herein is believed to be reliable, but we do not guarantee accuracy, timeliness, or completeness. It is provided “as is” without any express or implied warranties.
Equity securities are subject to price fluctuation and investments made in small and mid-cap companies generally involve a higher degree of risk and volatility than investments in large-cap companies. International securities are generally subject to increased risks, including currency fluctuations and social, economic, and political uncertainties, which could increase volatility. These risks are magnified in emerging markets.
Fixed-income securities are subject to loss of principal during periods of rising interest rates and are subject to various other risks including changes in credit quality, market valuations, liquidity, prepayments, early redemption, corporate events, tax ramifications, and other factors before investing. Interest rates and bond prices tend to move in opposite directions. When interest rates fall, bond prices typically rise, and conversely, when interest rates rise, bond prices typically fall.
There is no assurance that any investment, plan, or strategy will be successful. Investing involves risk, including the possible loss of principal. Past performance does not guarantee future results, and nothing herein should be interpreted as an indication of future performance. Please consult your financial professional before making any investment or financial decisions.
Indexes referenced are unmanaged and cannot be directly invested in. For index definitions visit https://www.marinerwealthadvisors.com/index-definitions/
Mariner is the marketing name for the financial services businesses of Mariner Wealth Advisors, LLC and its subsidiaries. Investment advisory services are provided through the brands Mariner Wealth, Mariner Independent, Mariner Institutional, Mariner Ultra, and Mariner Workplace, each of which is a business name of the registered investment advisory entities of Mariner. For additional information about each of the registered investment advisory entities of Mariner, including fees and services, please contact Mariner or refer to each entity’s Form ADV Part 2A, which is available on the Investment Adviser Public Disclosure website. Registration of an investment adviser does not imply a certain level of skill or training.