What Are the Long-Term Drivers of Economic Activity?

Most of my—and others’—economic comments tend to focus upon the cyclical, or shorter-term, view. Where is the economy within the current business cycle? What are the drivers that are moving the economy? What will the Federal Reserve policies bring about? These are all questions that I, along with others, tend to focus upon.
But for investors and businesspeople who have a longer-term view, thoughts concerning the longer-term drivers of economic activity may at times seem missing. It is in this spirit that I wrote the original “Passage Year” commentary in February. I sensed then that the world could be entering a new era, an era in which the prime drivers of economic growth and prosperity may be changing.
How could investors choose to use this work? To start, in longer-term capital allocation modeling. Empirical data shows that “strategic,” or long-term, allocation tends to dominate realized risk/return results as compared to probable return impacts from both tactical allocation and manager selection.
Capital allocation decisions revolve around expected returns and expected risk factors. I propose that long-term realized equity returns tend to be driven by many factors, but perhaps the most impactful are:
- Sustainable gross domestic product growth (driven by population or work force growth and worker productivity trends) and
- Inflation (driven by various factors, but heavily influenced by demographics and overall global trade activity).
- The combination of economic growth (profit growth) and interest rates (driven by inflation) tends to affect all asset returns, be they fixed income, equity or real estate.
The focus of this commentary is these three prime, fundamental economic and capital market drivers.
My “Passageways” theme proposes the view that the world’s economy is exiting an old, slow growth, low-inflation “room” and may be coming into a new “room” where these two main variables won’t be the same as in the “old room.”

As noted in the earlier commentary, in our lives we all pass from one life “room” into another. We pass from rooms where we were children, students, workers, then parents and on into old age. The time between these rooms tends to be periods of transition, periods of exiting comfortable surroundings and coming into new, and at times exciting, surroundings.
If we look back in time, the same can be said about the economy. We pass from one period to another, where the overall macro-drivers tend to change over time. As in life, the passageway—the time between the two economic rooms—can be exciting but full of uncertainty. Today’s piece continues the discussion of the economic transition that I suggest we are now experiencing. While my outlook is of course open for debate, it is a debate that most investors should consider while making important capital allocation decisions.

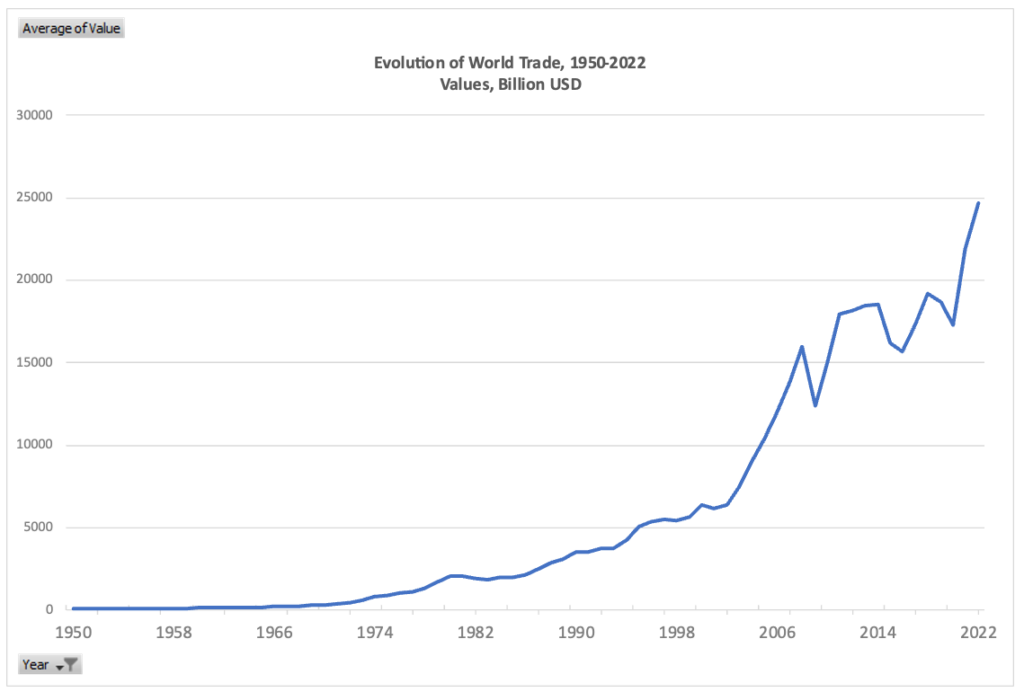
Source: World Trade Organization
The “Old” Room
So, what do I think may be different in the new economic room as compared to the room that we occupied over the last 10- to 20-year period?
I believe the old room held the following characteristics:
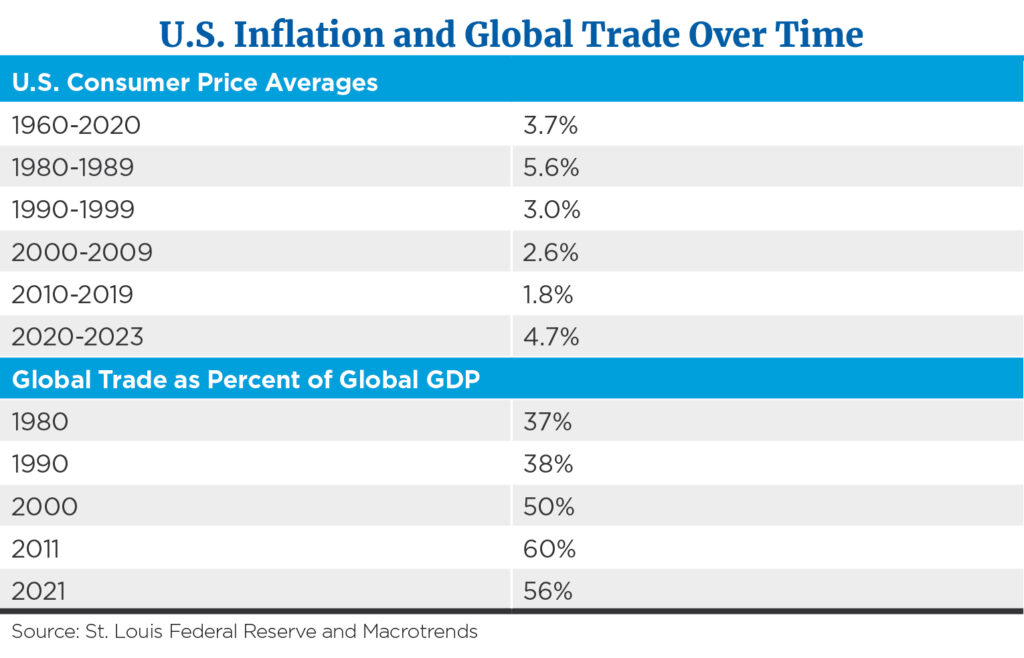
- A period of never-ending deflationary pressure. Inflation averaged 1.8% over the 10-year period ending in 2019 (pre-pandemic).1 Based on long-term (1960 to 2020) inflation, the previous period was an outlier to normal inflation, which averaged 3.7% annually.2
- A period of rapid growth in the globalization of the world’s economy. In 1970, global trade represented 25% of world GDP.3 In 2019 (prior to the pandemic), global trade had grown to 56% of world GDP.4 This period of rapid poverty reduction was arguably the result of the period when economic globalization was rising rapidly.
- A period where, according to the World Bank, global deep poverty rates declined dramatically. Rates declined from 1.8 billion people in the year 2000 to 650 million in 2019—a decline of 64% over a 19-year period. This registers as one of the strongest periods of reducing deep poverty on record.5
- A period of world peace, particularly for the developed nations. Worldwide battle deaths during the early part of the current millennium were the lowest per 100,000 people in decades.6
All these factors led to a period (2010 to 2022) when inflation was extremely low, growth was stable (but lower than normal), government interest rates (on a “real” basis) were broadly negative, and the only recession that occurred was driven by the pandemic, not economic excesses, with that recession lasting only a few months. The world by and large was at peace.
Global economic power (particularly global manufacturing capabilities) shifted from the democratic to the autocratic group over the last 20 years, emboldening those countries to reach out seeking legitimacy and power on the global stage.
Additionally, government spending and debt levels in many cases have grown more rapidly than economic growth, leading to government spending and borrowing being more impactful than has been the case, on average, over the last number of decades.
From a demographic standpoint, the world’s major economies are all aging, leading to many stresses (and opportunities) that will be different than the world faced on a macro scale over the last 10 to 20 years.
The world has enjoyed a “peace dividend” since the end of the superpower nuclear threat. Along those same lines, David Ricardo’s economic “comparative advantage” was able to spread its wings as global trade lifted billions of people out of deep poverty.7 The entire world benefited from low consumer prices as global trade as a percentage of world GDP rose dramatically. The exporting world (primarily China) benefited by outsized economic growth as it became the low-cost global factory floor. In addition, importing world consumers benefited by low price inflation.

As the chart above shows, U.S. inflation (CPI) declined from an average of 5.6% annually in the 1980s to a low of 1.8% for the 10 years ending in 2019 (longer-term annual average of 3.7%).
Corresponding to the macro-trend decline in U.S. inflation was the secular increase in global trade as a percent of global GDP. As noted, global trade activity was at 37% of GDP in 1980, increasing to 60% of global GDP in 2011. Since then, we have seen a retracement of part of the gain witnessed from 1980 to 2011.
Over the period of 2010 to 2021, the stock market (S&P 500) generated a total return of 438% (15.1% annual), significantly outperforming not only its own historical average return of about 11% but also dramatically outperforming the U.S. bond (AGG) market by 11.6% annually.8 It was a golden time to own U.S. stocks and a poor-to-mediocre period to own bonds, because much of fixed income barely outperformed inflation.
The “New” Room
The fundamentals that led to the golden period noted above are slowly changing. Some of the changes are being driven by the worsening in relations between the autocratic and democratic societies. Along with others, I count China, Russia, North Korea, Iran, Cuba and Venezuela in the autocratic camp. Most other countries—particularly the developed countries—are counted in the democratic group.
Are these like trends between inflation and global trade happenstance or is there a cause and effect in play? Based on David Ricardo’s comparative advantage concept mentioned previously, there is a cause and effect in play between trade activity and inflation. As an example of this theory, there are good reasons oranges are grown in Florida and wheat is grown in Kansas. The cost of growing citrus fruit in Florida is much cheaper and more efficient than in other parts of the country. Therein lies the benefit of industrial manufacture of low-value-added products (coat hangers, for example) in low-labor cost centers.
But not all people in the importing world have benefited. As factory jobs were exported from the developed countries (U.S., Europe and Japan), those displaced factory workers saw their jobs and factories disappear. In many cases, their jobs disappeared for good and weren’t replaced by “like” jobs. Nationalistic movements arose in many of the developed economies—the U.S. included.
The trend of ever-increasing trade volume driving ever-lower inflation seems to have peaked and is in the process of retreating, driven by the fundamentals previously noted. After all, where are the next one billion low-cost factory workers going to come from after China?
Characteristics of the New Room
I suggest the new room may contain the following fundamental drivers:
- Global political friction may continue to escalate due to the rise of China as a real-world power and the increased radicalization of China’s and Russia’s leadership.
- High levels of global political separation as countries align their interests more directly with either the democratic or the “autocratic” power bases.
- Onshoring of manufacturing capabilities may become the norm rather than the exception. At the very least, investors should expect companies to expand sourcing away from China toward other venues. This activity may increase costs, helping to maintain a higher core inflation rate than seen over the last two decades. The global push in nationalistic tendencies will lessen the benefit of Ricardo’s comparative advantage.
Drivers specifically of rising inflation and real GDP growth include:
- Slightly higher levels of nominal GDP growth than has been the case over the recent past. Within nominal GDP growth, we need to consider both inflation and real GDP growth rates.
- Expect higher overall inflation pressure of 3% to 4%. Gone are the days when inflation was an afterthought for consumers and producers alike. A return to a more normal inflationary environment may occur.
Drivers away from deflation toward a more normal inflationary environment include:
- A reshoring effort regarding supply channels may be expensive. Expect the safety net of multiple supply channels to be offset by higher business costs, leading to pressure on profit margins in certain businesses.
- The days of ever-higher globalization of the world’s economy as a percent of GDP peaked four years ago and probably won’t rebound as we move forward, slowing the driver that has lowered the deep poverty rate in emerging and frontier economies.
- Worker productivity is now negative, but improvement may be at hand. Will artificial intelligence be a productive economic force or will it simply be something that causes job losses?
- Real GDP growth should be systemically lower than the longer-term average as the outlook is calling for 2% real GDP growth to unfold over the next cycle as compared to the longer-term average of 3.1%. The slower real growth forecast is driven by:
- Low population growth with the aging of the workforce and new workers’ “social preferences.”
- Government spending (as a percentage of GDP) should be higher on average than has been the case over the historical longer term, leading to higher interest rates and higher taxes (slower growth?).
- Government spending to GDP has risen rather dramatically since the pandemic. Going forward, unless arrested the new annual deficit may exceed 7% of national GDP.9
- Funding of this spending level is up for grabs (increased taxes/more borrowing/printing money?).
- A continuing movement toward global acceptance of the “green” initiative, including high expenses on the shift from carbon-based toward renewable energy sources, increasing various energy costs.
I suggest the raw stuff of economic growth should constrain real growth going forward over the longer term.
Nominal and Real GDP Growth Outlook – Longer Term
With real GDP growth averaging 2% and inflation at 3% to 4%, nominal GDP growth should center between 5% and 6% over a full cycle compared to the 4.1% average nominal GDP growth our economy experienced from 2009 to 2022.10 Along with higher nominal GDP growth, we should expect to see shorter, more traditional business cycles unfold as businesses of many types adjust inventory management systems. The days of seven to 10-year business cycles may contract to the five to seven-year range (typical of previous, “just-in-time” inventory management systems).
With all the above, the central tendencies for interest rates could be higher than was the case during the ultra-low inflation period of 2010 to 2020. Remember, real U.S. Treasury 10-year yields have averaged +1.5% over the long term.11 Using this simple historical tendency, investors may expect to see longer-term yields to run in the 4.5% to 5.5% range at the peak of cycles.
I suspect the days of peaceful political global coexistence will change. While outright military wars may not occur, the threat of the world being divided between “us” and “them” could escalate. This environment may be more reminiscent of the 1970s than the last couple of decades. This suggests the long-lasting peace dividend has probably been spent.
Last Word
In summary, I suggest forces are coming into play that should drive investor preference away from the U.S. equity market being the only game in town that generates reasonable returns. Perhaps the global capital markets will generate good returns in various asset classes other than just U.S. equities.
I believe investors who pay attention to the new fundamental drivers, where inflation and the cost of capital may be higher than has been the case over the last decade, will be rewarded. Growth will occur, as nominal GDP growth may exceed that experienced over the deflationary economic period.
With higher nominal GDP growth comes higher business top-line growth. But with an increase in systemic inflation pressure, increased levels of currency volatility and a growing government presence that will need funding, profit margins may be under pressure at times. Specific winners may be highlighted as those having good control over middle-line expense variation.
With all this in mind, it is reasonable to look for shorter, more volatile business cycles to occur than was the case previously. The return variation between winners and losers may widen as we move forward.
Welcome to the “New Room.”
Footnotes
1,2St. Louis Federal Reserve
3World Bank
4Vox
5World Bank
6Vox
7World Bank
8Thompson/Reuters
9The Economist
10,11St. Louis Federal Reserve
The S&P 500 Index is a market-value weighted index provided by Standard & Poor’s and is comprised of 500 companies chosen for market size and industry group representation. The index is unmanaged and cannot be directly invested into. Investing involves risk and the potential to lose principal. Past performance does not guarantee future results.
This commentary is limited to the dissemination of general information pertaining to Mariner Wealth Advisors’ investment advisory services and general economic market conditions. The views expressed are for commentary purposes only and do not take into account any individual personal, financial, or tax considerations. As such, the information contained herein is not intended to be personal legal, investment, or tax advice or a solicitation to buy or sell any security or engage in a particular investment strategy. Nothing herein should be relied upon as such, and there is no guarantee that any claims made will come to pass. Any opinions and forecasts contained herein are based on the information and sources of information deemed to be reliable, but Mariner Wealth Advisors does not warrant the accuracy of the information that any opinion or forecast is based upon. You should note that the materials are provided “as is” without any express or implied warranties. Opinions expressed are subject to change without notice and are not intended as investment advice or to predict future performance. Consult your financial professional before making any investment decision.
Mariner is the marketing name for the financial services businesses of Mariner Wealth Advisors, LLC and its subsidiaries. Investment advisory services are provided through the brands Mariner Wealth, Mariner Independent, Mariner Institutional, Mariner Ultra, and Mariner Workplace, each of which is a business name of the registered investment advisory entities of Mariner. For additional information about each of the registered investment advisory entities of Mariner, including fees and services, please contact Mariner or refer to each entity’s Form ADV Part 2A, which is available on the Investment Adviser Public Disclosure website. Registration of an investment adviser does not imply a certain level of skill or training.

