Straws in the wind: Framing 2026 outlook

Read time: 9 minutes
We’re coming up on that time of year when we start looking ahead—thinking more seriously about what the economy may hold in the coming year. Of course, we’re always looking forward, and today’s work marks the start of developing our core economic outlook for the U.S. heading into the new year.
We’ll lay the groundwork for that outlook by focusing on GDP growth—the foundation on which the rest of our view will be built—and on the key variables we believe will shape U.S. GDP growth in 2026.
Wrapping up 2025
We need to continue our dialogue about the 2025 outlook, since this year hasn’t yet been written into the history books. Regular readers will recall that our economic theme this year is “Three Yards and a Cloud of Dust.” I’ve used this metaphor to describe a football play that gains steady, positive—but limited—yardage, though not without some scuffling along the way.
In this view, we’ve been calling for slow but positive GDP growth in 2025—between 1.5% and 2.0% in real terms—and so far, growth has been running at about 2.0%. Our outlook has largely played out, even amid the uncertainty of the administration’s “Four Buckets” (deportation of undocumented immigrants, tariff implementation, tax legislative package and DOGE efforts) that created the “cloud of dust” we anticipated.
Importantly, we’ve assigned a 60% “confidence level” to this outlook. Given the significant economic implications of current policies, that seems appropriately measured. The remaining 40% was reserved for a potential recession, which so far hasn’t occurred.
Of course, 2025 isn’t over yet. With the current government shutdown, we’re flying the economic outlook plane with limited visibility, as many key economic reports are delayed. Still, for now, we’re sticking with our “Three Yards” core theme.
Setting the stage for 2026
Systemic growth variables
Over the past several years, the U.S. economy has displayed a very stable growth profile. Since the year 2010—excluding the “manufactured” boom/bust years of 2020-2021—real GDP has grown at an average of 2.45%, with a standard deviation of 0.43%.
Before that period, growth averaged 2.87% with a higher standard deviation of 2.16%. In other words, volatility in U.S. growth has fallen by nearly 80% compared to the prior 40 years. This development hasn’t received much attention, but I believe it’s meaningful—not only to economic activity, but also for explaining why risk-based asset class returns have been robust.
| Average Real GDP Growth in the US from 1970 through 2023 | |||
|---|---|---|---|
| 1970-2023* | 1970-2009 | 2010-2023* | |
| Average GDP Growth | 2.8% | 2.9% | 2.5% |
| Standard Deviation | 1.9% | 2.2% | 0.4% |
| *Excludes data from 2020-2021 | |||
Note: Data excludes the “manufactured” GDP collapse and rebound of 2020-2021 (data: Bureau of Economic Analysis). I believe this approach is valid, as the economic collapse was driven by government-mandated shutdowns rather than normal market forces—a “manufactured” recession rather than part of the business cycle.
Why has growth volatility declined so dramatically? I believe it’s due to:
- A significant level of surplus capital being available on a global basis. Capital availability totals $27 trillion on a global scale,1 which has led to low “real” interest rates and inflation.
- A decline in global birth rates is limiting today’s and the future’s labor force expansion and, in turn, constraining consumer final demand growth rates. Between 2025 and 2030, global population growth is projected at just 1.5% annually—half the pace of the last 75 years—and it’s expected to slow further, averaging just 0.3% per year over the next 75 years.2
Population-driven final demand growth has slowed to roughly half its normalized rate, and that deceleration should continue. Combined with excess capital availability, these forces have created a prolonged period of slower growth and low interest/inflation rates.
As we begin shaping our 2026 GDP outlook, it’s important to recognize that these systemic forces remain in place and are likely to continue driving modest growth. For perspective, over the last 65 years, GDP has averaged 3.0% annual growth and inflation 3.7%. Since 2010, those averages have dropped to 2.4% and 2.6%, respectively.3
Other variables to weigh
With the backdrop of slower growth and muted inflation pressures, several positive variables I expect to weigh on 2026 growth include:
- Tax refunds paid during the first half next year should be meaningful and boost consumer spending.
- Capital spending continues to rise and should strengthen into 2026, supported by 100% first-year depreciation allowances on many capital investments.
- Monetary policy remains accommodative, with the Fed leaning toward rate reductions and quantitative tightening expected to ease.
- Global central banks are also accommodative—roughly 84% of policy actions in 2025 have been easing moves rather than tightening, according to central bank tracking website cbrates.com.
- Policy uncertainty tied to the administration’s “four buckets” has largely subsided, reducing the uncertainty that weighed on 2025’s outlook.
- Productivity gains from capital investment in artificial intelligence (AI) remain a key wild card that could further influence growth.
At the same time, several factors may weigh heavily on GDP growth as we enter the new year:
- Housing price gains have flattened. The latest Case/Shiller National Home Price Index data shows housing values are up just 1.5% year-over-year through August—below the rate of inflation. That could soften discretionary spending as the “wealth effect” fades relative to prior years.
- The jobs market has been showing signs of weakening (see chart below).
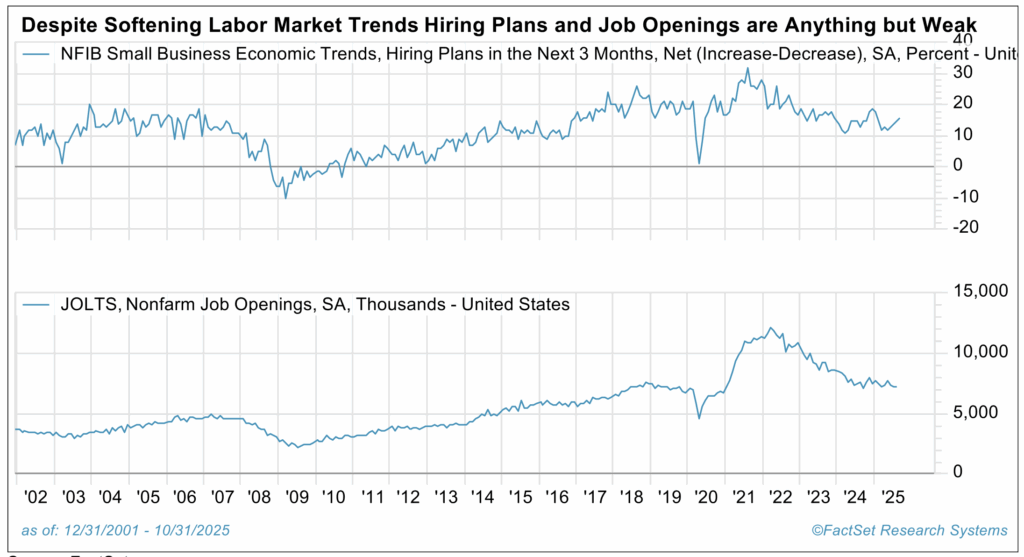
Source: FactSet
- Consumer sentiment has also weakened alongside these labor trends. The consumer sentiment index is overlaid against the “Misery Index”—the sum of unemployment and inflation rates. Historically, the Misery Index has been negatively correlated with sentiment (higher misery = lower sentiment), but the recent data shows both have declined. This suggests that while unemployment remains low, consumers sense weakening trends in the job market, which could temper spending going forward.
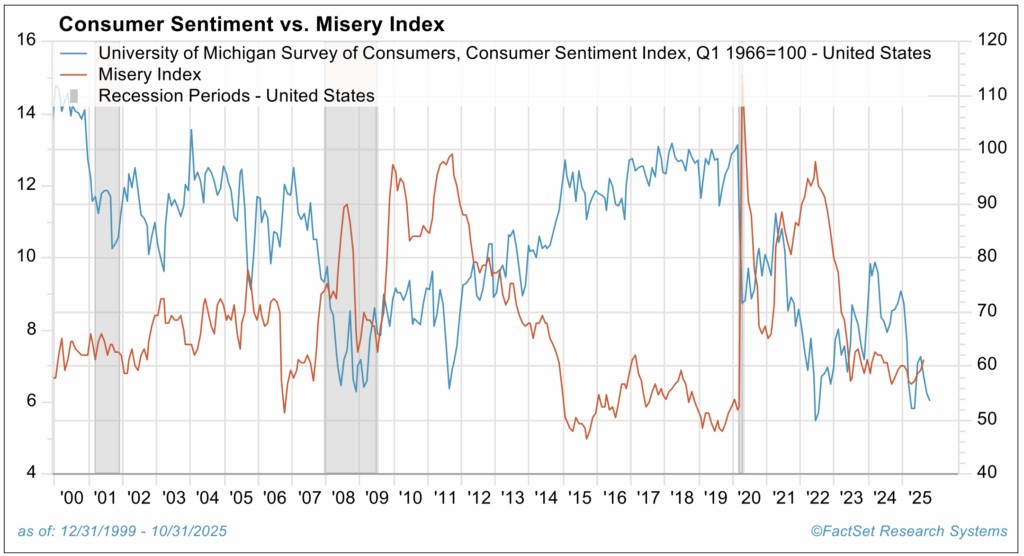
Source: FactSet
All of this leads us to a preliminary view that the U.S. economy will continue to grow next year, though likely at a constrained pace similar to recent years. While many forecasts for 2026 suggest that growth will be below 2%, our view tends to differ slightly.
Growth projected above 2%
I believe the seeds of growth acceleration are being planted. Along with the factors already discussed, a key driver of this positive outlook lies in worker productivity growth rates—a measure that’s difficult to assess in real time. When analyzing productivity, it’s most useful to focus on “trend” data rather than simple quarterly data.

Source: FactSet
The chart above shows quarterly changes in worker productivity (blue bars) and the trailing 12-month trend (orange line). Note the negative blue bar in the first quarter of 2025, when GDP growth declined 0.5%. That drop stemmed from a surge in imports as businesses were preparing for the onset of new, higher tariffs—a distortion that negatively affected worker productivity data.
Still, the trend toward higher worker productivity appears to be taking hold. Since mid-2023, there have been seven quarters in which worker productivity growth exceeded 2%, compared with only four quarters below that level—and one of those was the negative first quarter of 2025.
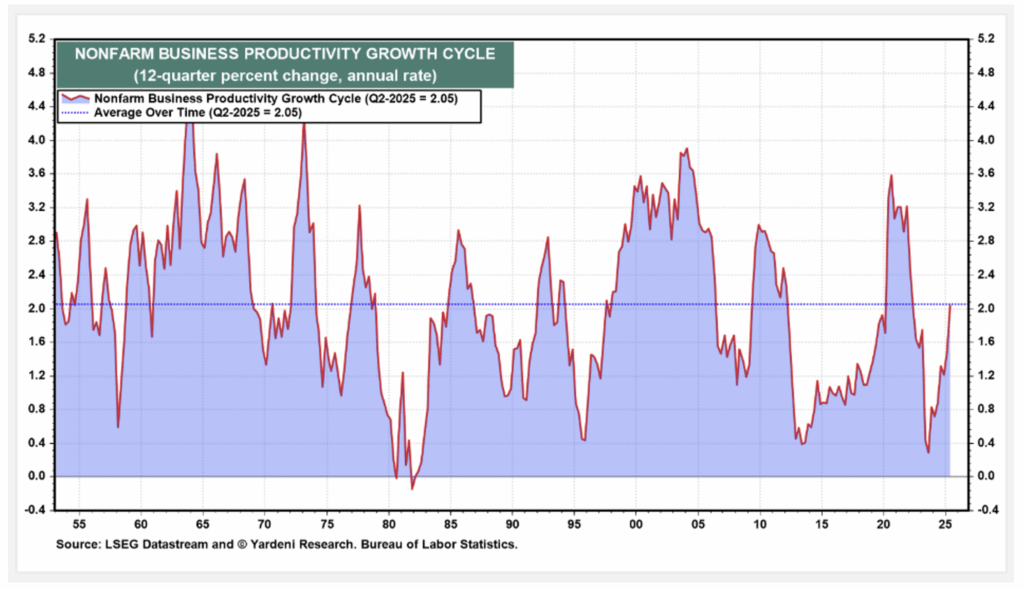
Source: LSEG Datastream and Yardeni Research
The trailing five-year worker productivity trend shows that growth has risen by an average of 2%. Historically, when productivity growth reaches this level, it continues to rise instead of peaking.
Last word
While we may not see a growth bonanza in the year ahead, the weight of the evidence suggests GDP growth should exceed 2% in 2026.
The combination of excess global liquidity, rising labor productivity and the factors highlighted earlier point to a generally positive backdrop for the U.S. economy as we enter the new year. With policy uncertainty easing and the evidence outlined above, I hold a 70% conviction that the economy should post growth above 2% in 2026.
That said, significant variables remain that could still dampen overall growth (many already discussed). As such, growth less than 2% carries the remaining 30% probability, though that scenario appears less likely at this time.
And what of recession? While an economic contraction is possible, our modeling suggests the probability of one is reasonably low at this time.
Sources:
1This is the sum of assets controlled by the top 100 sovereign wealth funds per Sovereign Wealth Fund Institute data, S&P 500 corporate cash on hand, and assets held in money market funds as of 9.30.2025.
2United Nations Population Data via Our World in Data.
3Inflation data is Consumer Price Index and YoY Growth per Bureau of Labor Statistics. GDP or Gross Domestic Product is YoY Growth per the Bureau of Economic Analysis.
This commentary is provided for informational and educational purposes only. As such, the information contained herein is not intended and should not be construed as individualized advice or recommendation of any kind.
The opinions and forward-looking statements expressed herein are not guarantees of any future performance and actual results or developments may differ materially from those projected. The information provided herein is believed to be reliable, but we do not guarantee accuracy, timeliness, or completeness. It is provided “as is” without any express or implied warranties.
There is no assurance that any investment, plan, or strategy will be successful. Investing involves risk, including the possible loss of principal. Past performance does not guarantee future results, and nothing herein should be interpreted as an indication of future performance. Please consult your financial professional before making any investment or financial decisions.
Mariner is the marketing name for the financial services businesses of Mariner Wealth Advisors, LLC and its subsidiaries. Investment advisory services are provided through the brands Mariner Wealth, Mariner Independent, Mariner Institutional, Mariner Ultra, and Mariner Workplace, each of which is a business name of the registered investment advisory entities of Mariner. For additional information about each of the registered investment advisory entities of Mariner, including fees and services, please contact Mariner or refer to each entity’s Form ADV Part 2A, which is available on the Investment Adviser Public Disclosure website. Registration of an investment adviser does not imply a certain level of skill or training.