Private Credit Markets – A Growing Force

Read time: 9 minutes
In the 1980s Michael Milken and Drexel Burnham effectively created a new debt market: the “high-yield” market was born. Milken and Drexel offered financing to businesses that were large enough to issue public debt, bypassing traditional bank financing, but that weren’t of high credit quality. “Less-than-investment-grade” credits became a real, tradeable asset class.
Rise of the Private Credit Market
What of companies that are too small to issue publicly traded debt but can’t meet commercial bank lending standards? New companies, companies with limited access to debt and the “small junk” market were all being underserved. Enter private credit funds. Data from the Hutchins Center on Fiscal & Monetary Policy show that in 2008—the last year in which the world experienced a fundamental (non-Covid-related) recession—$375 billion was invested in the private debt market. As of March 2023, private credit outstanding had risen to $1.6 trillion, an increase of 326%, or 10.1% growth per year.
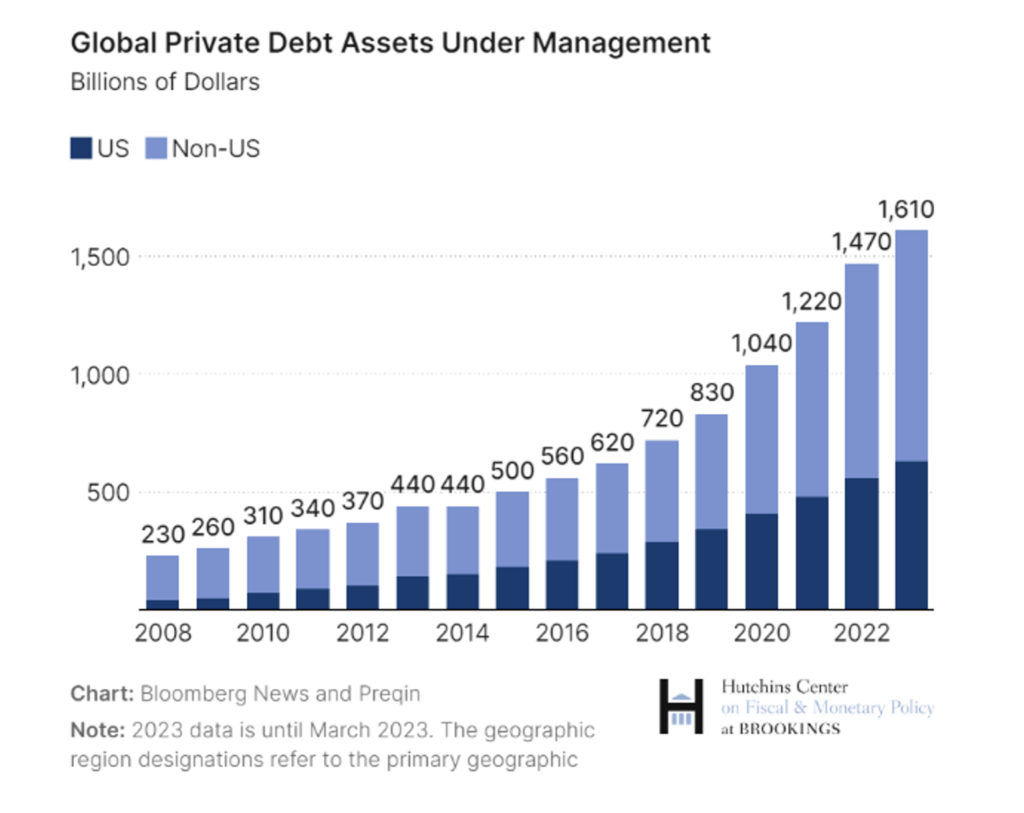
Until recently, much of the private credit market has resided in Europe. In the U.S., private credit outstanding in 2008 totaled a mere $40 billion.1 As of March 2023, there was $630 billion in private credit outstanding, a growth rate of 1,475%, or 20.1% per year.2 The foreign private credit market increased by 189.6% over the same period, or 7.3% per year.3 The U.S. is starting to dominate the private credit market like never before, as the chart here portrays.
Banks Take a Back Seat
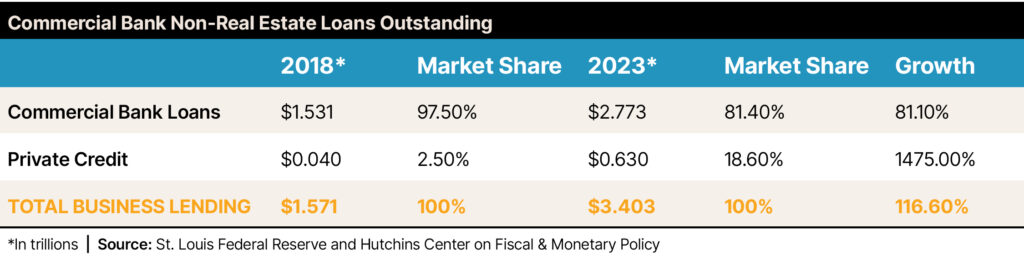
What of traditional commercial banks? What have they done in lending volumes over this same period? The folks at the St. Louis Federal Reserve report the following data, which shows commercial bank non-real estate loans outstanding, which is overlaid by data from the Hutchins Center.
Funding for the New Market
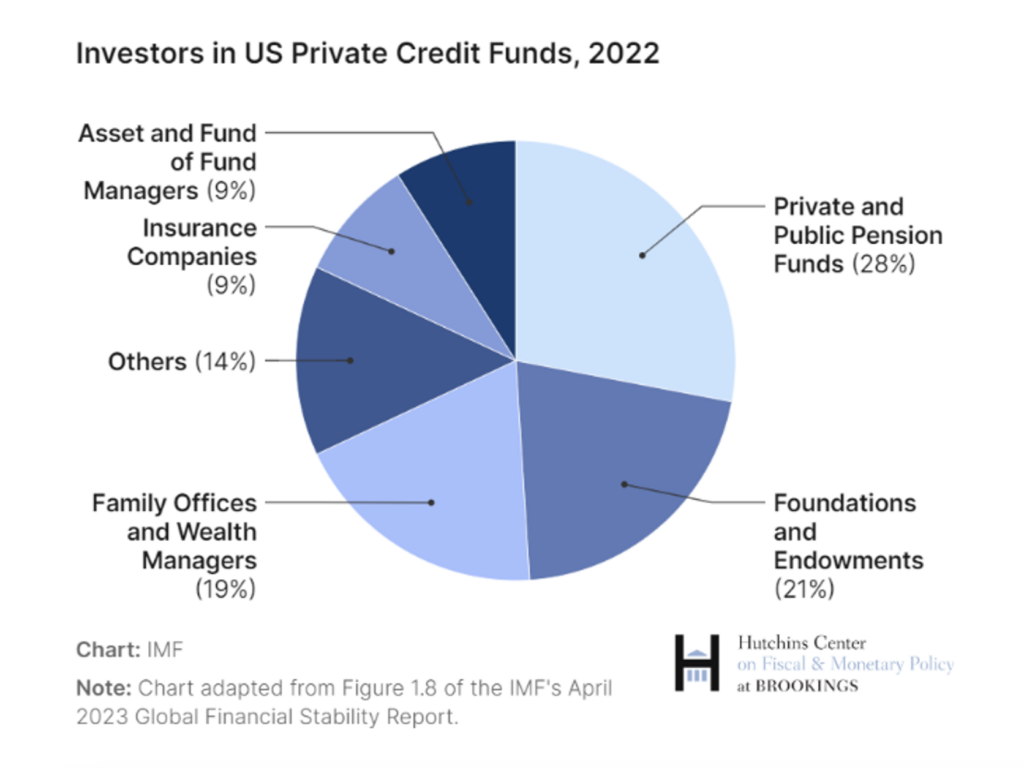
The funding of private debt investing comes from many of the same sources that traditionally have provided equity financing for small, private companies—private equity market investors. These are investors who have long-term time horizons in most of their investment decisions.
Note the chart below, which highlights the fact that as of 2022, upwards of 70% of capital invested in the private debt market was from pension plans, not-for-profit institutions and high-net-worth/family office organizations.4 These investors traditionally have held long-term time horizons in their decisions and don’t demand 100% liquidity availability, as is the case in many deposit bases within traditional commercial banking operations.
Not Your Father’s Credit Source
Commercial bank lending acts as a financial liquidity transformation process. Short-term deposits are transformed into longer-term loans. From a financial industry standpoint, this process is subjected to the pressures or opportunities provided by the shape of the yield curve.
Normally, long-term interest rates are higher than shorter-term rates, which provides banks and traditional lenders the opportunity to make money by “borrowing short” (bank deposits) and “lending long” (business and personal loans), taking advantage of the positive yield curve spread. Of course, when the normalized positive spread in interest rates reverses—as is now the case with an inverted yield curve—bank lending supply tends to contract. The reversal in yield curve structure has historically been driven by Federal Reserve monetary policies. When the Fed attempts to slow overall economic growth, it raises short-term rates above longer-term rates. This has been happening over the last two years.
Banks have historically been reluctant to lend due to the pressures that an inverted yield curve brings to banks’ profit levels. When yield curves have inverted in the past, recessions have typically followed within a two-year period following inversion. The current cycle shows the Treasury yield curve has remained inverted since the summer of 2022. No recession—yet.
Private lending actions have grown as noted above, stepping into the breach that the yield curve inversion has created in the banking arena. The private lending process doesn’t share the same liquidity transformation process as banks. Investors’ longer-term capital, and not short-term demand/savings deposits, is used to lend money to borrowers. Since private lending practices aren’t subjected to the same liquidity transformation process as traditional bank lending, do Fed monetary policies matter as much to the business cycle? I suggest this is one of the reasons why the U.S. economy has escaped recession over the last two years, given the yield curve has been in an inverted status.
Data provided by the St. Louis Fed backs up this thought. Banks’ industrial and commercial loans outstanding have risen by a mere 0.6% since August 2022 as compared to nominal gross domestic product growth of 7.5% over the same period. Typically, nominal GDP growth and bank lending tend to go hand in hand. Not this time around. I suggest private lending activities have helped maintain positive economic growth over this period when banks have been hesitant to maintain easy lending practices. Want more data? Since the end of the Great Recession (August 2010), bank lending has grown by an average of 6.2% per year, a growth rate in line with average nominal GDP growth. That is, until the recent past, as mentioned above.
An Untested Asset Class
One can question the efficacy of Fed monetary policies in controlling macroeconomic activity given the “mechanism” of monetary tightening on lending activity seems to have become altered. This is a valid question—and one I am unable to answer on a concrete basis. I have to answer this question with a “it depends” qualifier. The qualifier may be based on the future of the private credit market.
Another question that has been asked is what happens to the private credit market during the next severe economic downturn? Private credit issuance continued to grow during the “manufactured” downturn of 2020 (Covid) compared to traditional bank lending, which declined by 19.6% from May 2020 to November 2021.5 So, issuance (investor demand) within the asset class was seemingly unaffected by the recent pandemic-driven economic contraction.
Additionally, this asset class has paid investors higher yields than traditional credit markets due to typical liquidity and quality factors. Typical borrowers in the private credit business tend to be smaller companies (perhaps less mature) and lower-quality borrowers. It seems credit risks may be higher than in the traditional liquid market. In an interesting report, the folks at JP Morgan agree with this thought.
But it remains that the asset class hasn’t been tested by a deep, prolonged economic downturn, as assets under management in the class was much smaller during the previous 2007 to 2010 economic collapse. The high-yield bond market shares higher default risk potential with the private credit arena. When the junk bond market was in its infancy, Michael Milken, one of the “founders” of the high-yield market, suggested investors may need to assume a 2% to 3% default risk annually in the junk arena. Perhaps a similar assumption needs to be harbored by private credit investors?
Irrespective of the risks associated with the private credit market, it appears the growth in the private credit arena helps explain why, or how, the U.S. economy has escaped an outright economic downturn over the last two years when Fed actions created an inversion in the yield curve.
Worker Productivity Update
Over the last two months, I have written extensively about the importance and current position of worker productivity growth rates. A quick update of current events/conditions is probably appropriate.
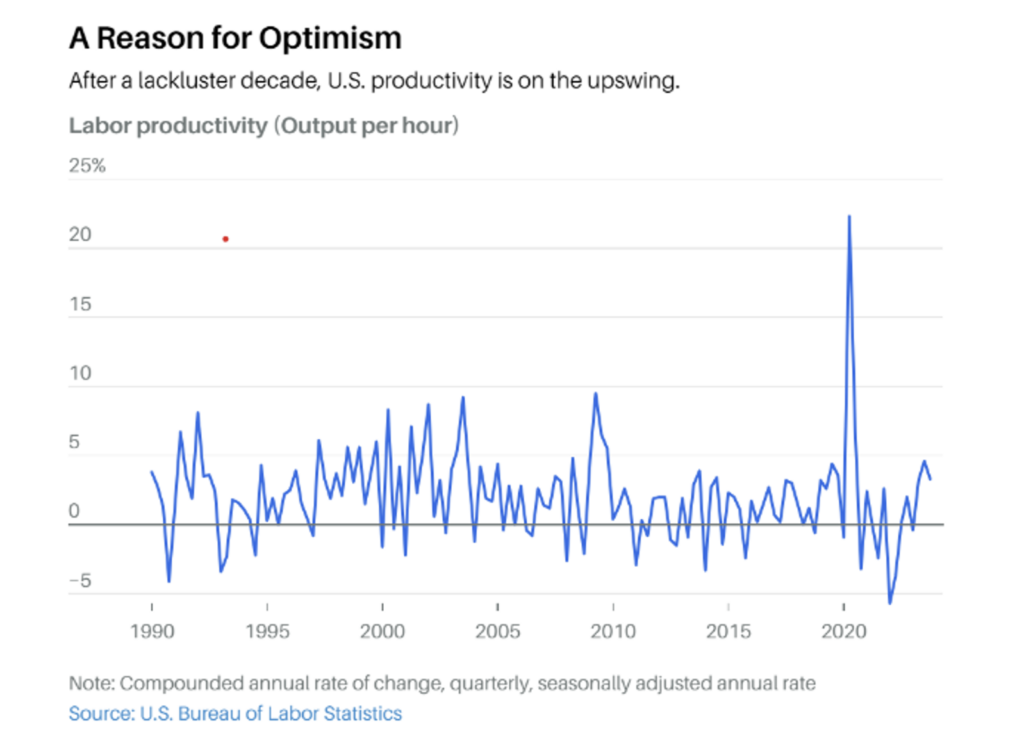
As noted in this chart, the U.S. Bureau of Labor Statistics has reported that labor productivity has recently increased to a 3% growth rate, a strong rate in relation to longer-term averages (1970 to 2023 average of 1.8%). Will the improvement in productivity last?
To help answer that question, we can turn to the potential impact artificial intelligence (AI) actions/products may bring to the fore. Talk about how AI will impact our lives/jobs is all over the map. Nobody knows the exact impact AI holds for the world going forward. But the folks at the International Monetary Fund have created an interesting work that shows the average possible impact of AI on worker productivity may be between +0.1% and 1.0% per year. The IMF suggests the possible impact on developed economies (U.S., China, Japan and Europe) should be higher than the impact on less-developed economies.
If that report holds water going forward, then the impact that AI may bring to worker productivity levels in the U.S. may be between +0.5% and 1.0% annually. This is potentially a huge issue. We will see how all this unfolds.
Sources:
1-4Hutchins Center on Fiscal & Monetary Policy
5St. Louis Federal Reserve
This commentary is provided for informational and educational purposes only. It is not intended to be personalized advice or a recommendation to buy or sell any security or engage in a particular investment or other strategy. Nothing herein should be relied upon as such, and there is no guarantee that any claims made will come to pass. Actual results or developments may differ materially from those projected. The information is deemed reliable, but we do not guarantee accuracy, timeliness, or completeness. It is provided “as is” without any express or implied warranties. Any opinions expressed are subject to change without notice and are not intended as investment advice or to predict future performance.
Investing involves risk and the potential to lose principal. Past performance does not guarantee future results. Please consult your financial professional before making any investment or financial decisions.
Mariner is the marketing name for the financial services businesses of Mariner Wealth Advisors, LLC and its subsidiaries. Investment advisory services are provided through the brands Mariner Wealth, Mariner Independent, Mariner Institutional, Mariner Ultra, and Mariner Workplace, each of which is a business name of the registered investment advisory entities of Mariner. For additional information about each of the registered investment advisory entities of Mariner, including fees and services, please contact Mariner or refer to each entity’s Form ADV Part 2A, which is available on the Investment Adviser Public Disclosure website. Registration of an investment adviser does not imply a certain level of skill or training.