Sprinting Into the Locker Room at Half-Time! Is this Real or Fear of Missing Out?

Read time: 21 minutes
No doubt about it, the market is exhibiting some mojo as we close out the first half of 2025.
The S&P 500 had an outstanding June, with a total return of roughly 5% for the month. This was on the heels of a more than 6% total return in May, which made for one of the best Mays on record for this bellwether large cap U.S. equity index.1 The S&P 500 has displayed swagger ever since the current White House administration called it’s “tariff time out” (TTO) on April 8.
Such strength in the equity markets stands in stark contrast to the rather abrupt and significant market swoon of almost 20% from February 19 to April 8. This decline followed the president’s announcement on April 2 of significantly increased tariff duties affecting most U.S. trading partners.
Specifically, the S&P 500 peaked at a closing level of 6,144 on Feb. 19, before falling to a low of 4,982 shortly after the April 2 “liberation day.”2 The magnitude of the announced tariff rates scared consumers, investors, CEO’s and small business owners. That was apparent in the rapid deterioration we witnessed in the sentiment and confidence surveys.
Fortunately, the trade policy makers hit the pause button quickly via the timeout on implementing the tariffs until July 9 and allowing for 90 days of negotiations—and the possible signing of new trade agreements—in this “cease fire” window. The markets have since cheered this all-important TTO news, which has carried the S&P 500 back above the prior February 19 peak and on to an all-time high as of June 30.
In a nutshell, the final equity returns for the first half of the year are pretty darn solid. From the jaws of defeat and double-digit declines on a year-to-date basis through the spring, U.S. stocks have rallied back to a quite respectable total return of over 6% for the year through the end of June. The market is very much on track to achieve our base case outlook we outlined for 2025 back in January.
It’s noteworthy that the health exhibited in the markets has been fairly widespread across stocks and sectors; it wasn’t led by just a handful of names. Yes, prior concentrated leadership such as information technology stocks—and the Mag 7 in particular—fell far more than the overall market during the swoon. However, they’ve handsomely outperformed in the recovery and have resumed their strong price trends in the closing months of the half.
But other diverse sectors that have also demonstrated momentum (and that have also hit or are nearing all-time highs) include communication services, industrials, financials and utilities. The cyclicals and risk-on oriented growth sectors are outperforming the defensives such as staples, healthcare and energy, which is a positive sign. We should mention that international stocks continue to outperform U.S. equities and show strength as well, as we anticipated. The decline was broad, just as the advance has been broad-based.
A Volatile Path to Decent Gains—Clear Air Turbulence, Indeed
Clearly, the comments above capture the roller coaster ride to ultimately decent gains through mid-year. Little did we appreciate in January how prophetic our 2025 theme of “Clear-Air-Turbulence” (CAT) in the financial markets would be. The ~20% late winter/early spring air pocket was followed by a ~20% late spring/early summer rebound: A resumption to prior altitude and a very pleasant landing during the approach to the June 30 final destination. That defines CAT.
Indeed, investors have enjoyed a great close to the second quarter and first half, and the momentum in May and June was robust. That said, it’s not the time to become complacent. We believe we’ll see plenty more CAT even as we eventually move on to higher highs over the next twelve months.
With the recent rally, investors must be pondering if this mojo is real and based on solid earnings and a resilient economy. Or, has this recent rally merely been ignited by FOMO (fear of missing out)? Is this recent post-TTO surge simply temporary relief that the trade wars and military wars seemed to have calmed a bit, and avoided worst case outcomes for now?
Through our research, we happen to believe it is the former. However, as Yogi Bera said in 1973 when his New York Yankees team was struggling in last place before going on to win the division title that year, “It ain’t over until it’s over.” Unfortunately (or fortunately), in the markets, it’s never really over.
There’s a lot of policy news to come in the next several months on the trade, tax legislation and Federal Reserve front, and there are quite a few geopolitical tensions to be resolved. Importantly, there are plenty of upcoming economic and financial market data releases in Q3 that we’ll examine closely. The trend in these metrics will clarify and tell us if these policy issues are having an actual negative impact on the fundamentals.
A “Soft Data” Problem, Not a “Hard Data” Issue
We believe that the roller coaster ride in returns during the first half was the result of violent swings in headlines surrounding tariff policy proposals and associated rhetoric. Some geopolitical shocks (Ukraine/Russia and Israel/Iran) were also contributors, as was speculation about final outcomes and timing on the fiscal policy front—for example, the proposed tax cut legislation and its impacts on the U.S. deficit.
The point is that it was mainly worry and psychology around these pending policy-related issues that sparked a temporary crisis in the consumer and CEO confidence measures, small business optimism and investor sentiment as we cited above (the “soft data” metrics). This is what whipped around the P/E levels of the market from 22 times forward earnings down to 18 times at the April 8 low and then back to 22 at June’s end as confidence firmed.3
Importantly, there was little change in the “real” hard data—such as economic and earnings growth—that are part of the fundamental, valuation and technical indicators (FVTs) we monitor relentlessly; they have remained constructive throughout as shown in the table below. It’s the FVTs that truly drive markets on a more sustained, long-term basis.
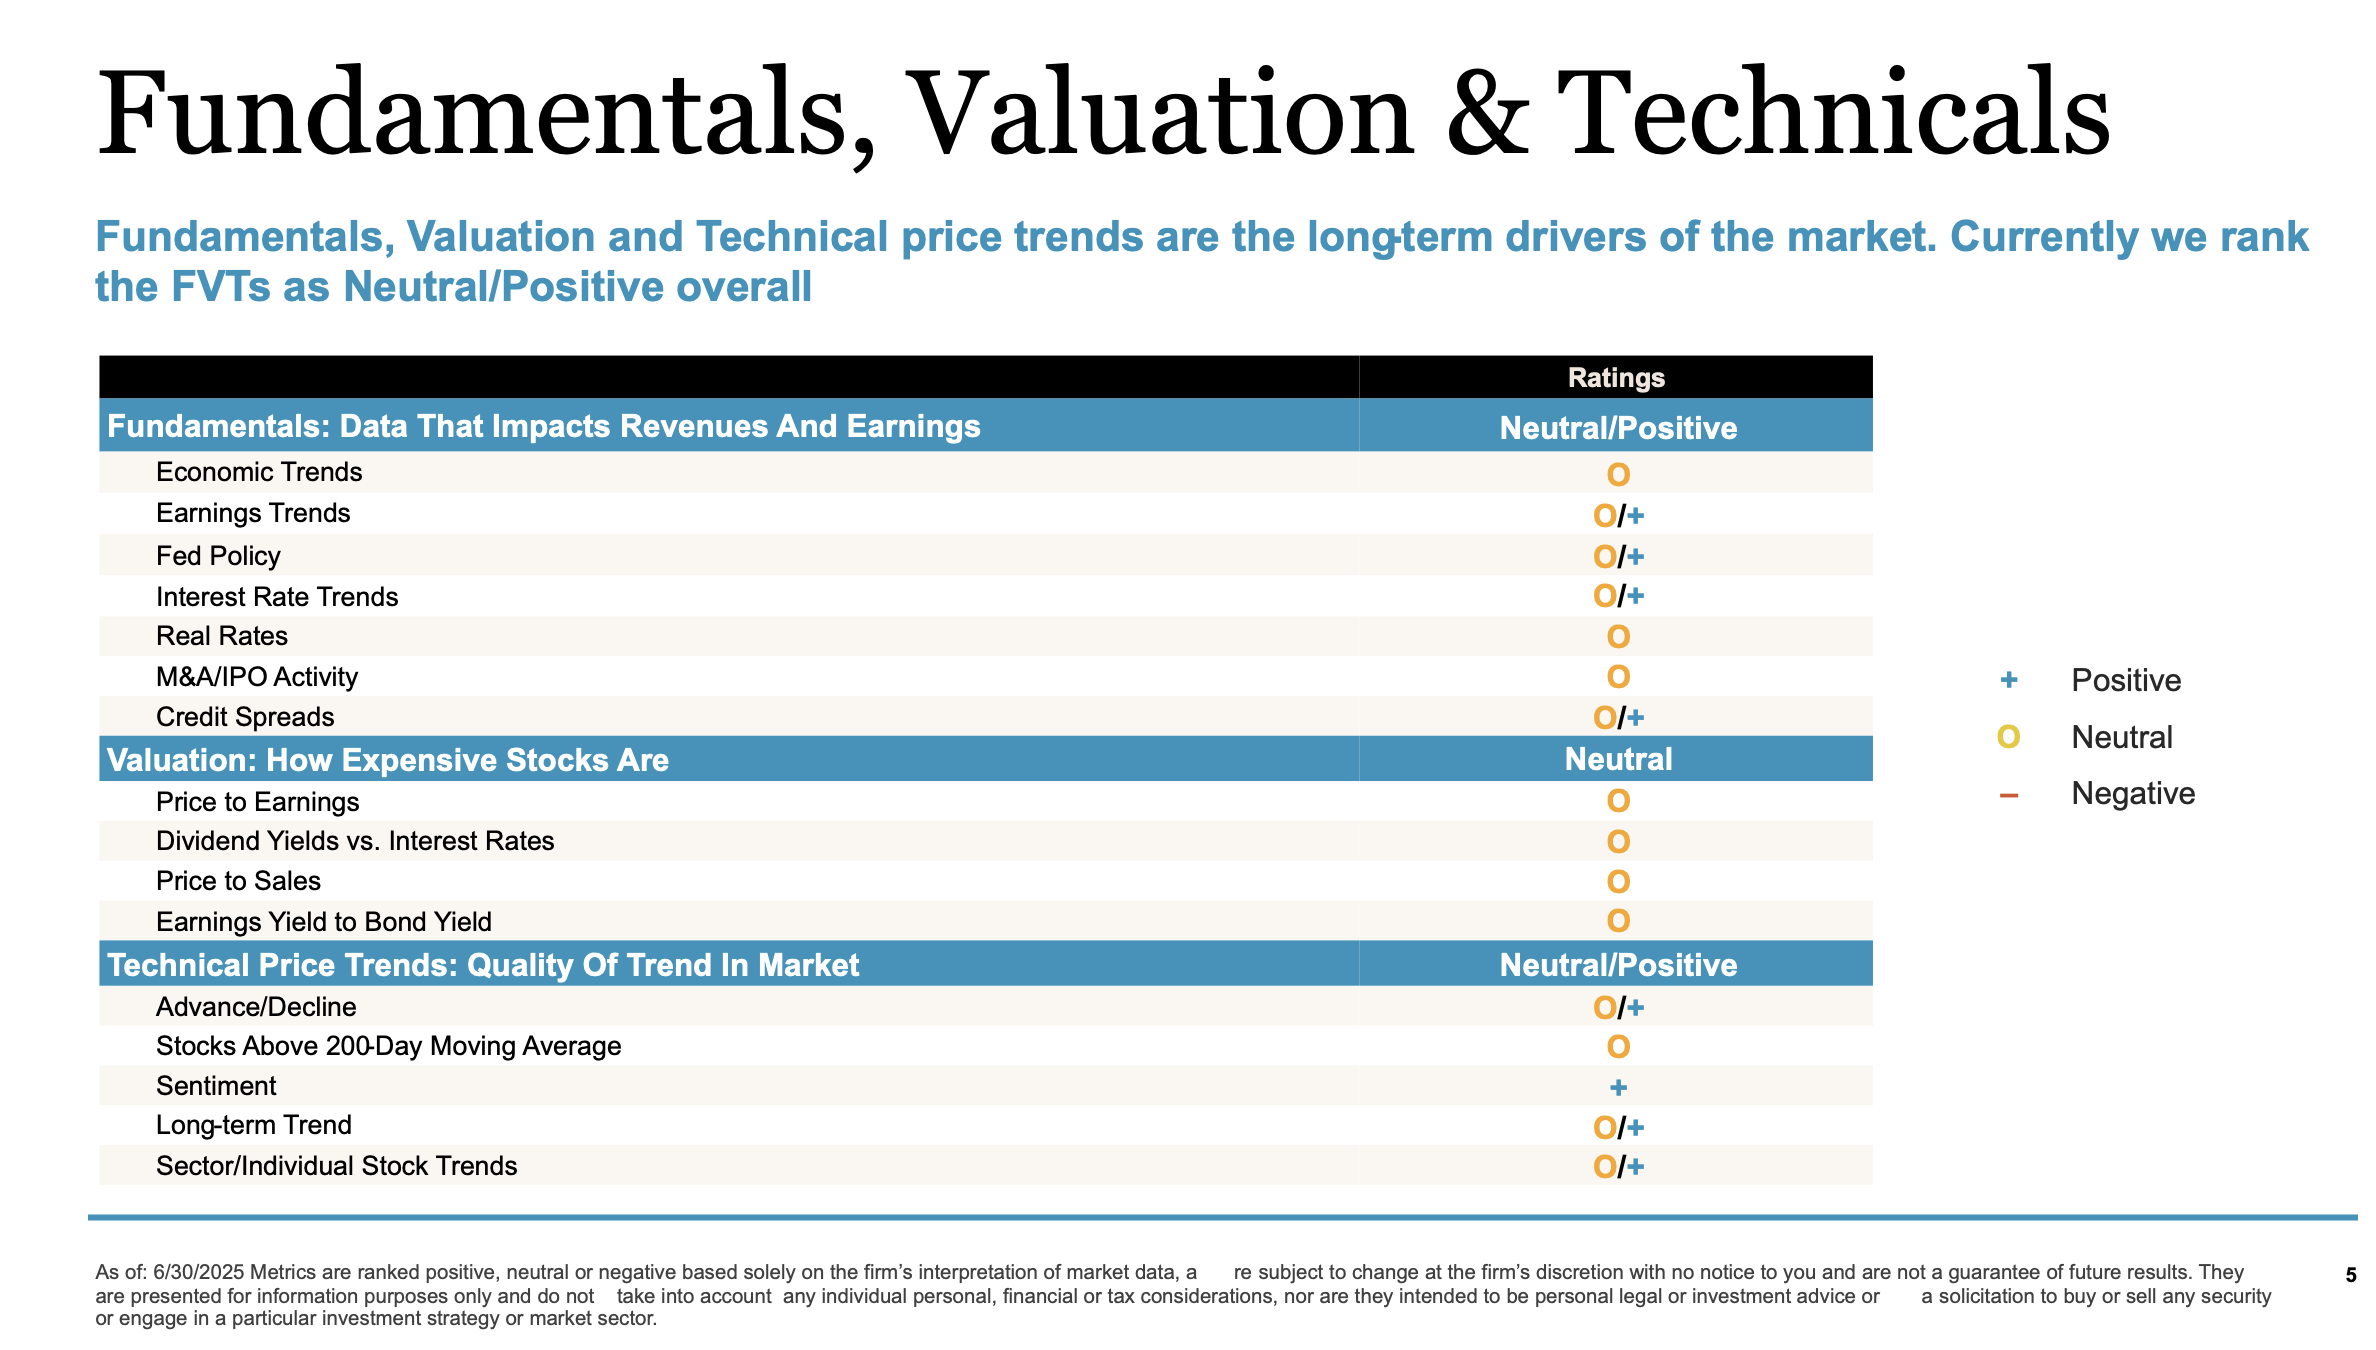
Swings in P/E levels and associated trend reversals in confidence are temporary risks that self-correct. We’re comforted and maintain our positive base case 2025 outlook at present, because the hard data has been consistently solid and resilient.
A Measured, Data-Driven Perspective Is Key
Our message of embracing patience and employing more balanced positioning in 2025 versus 2023 and 2024—with focus on both return and risk protection this year—is all intended to help our clients avoid lobbying for premature decision-making and temptation to make major shifts in their asset allocation. This can lead to whiplash in returns and wealth destruction. Many of our peers have made significant adjustments to their price targets and their odds of recession repeatedly this year, as policy rhetoric shifts again and again:
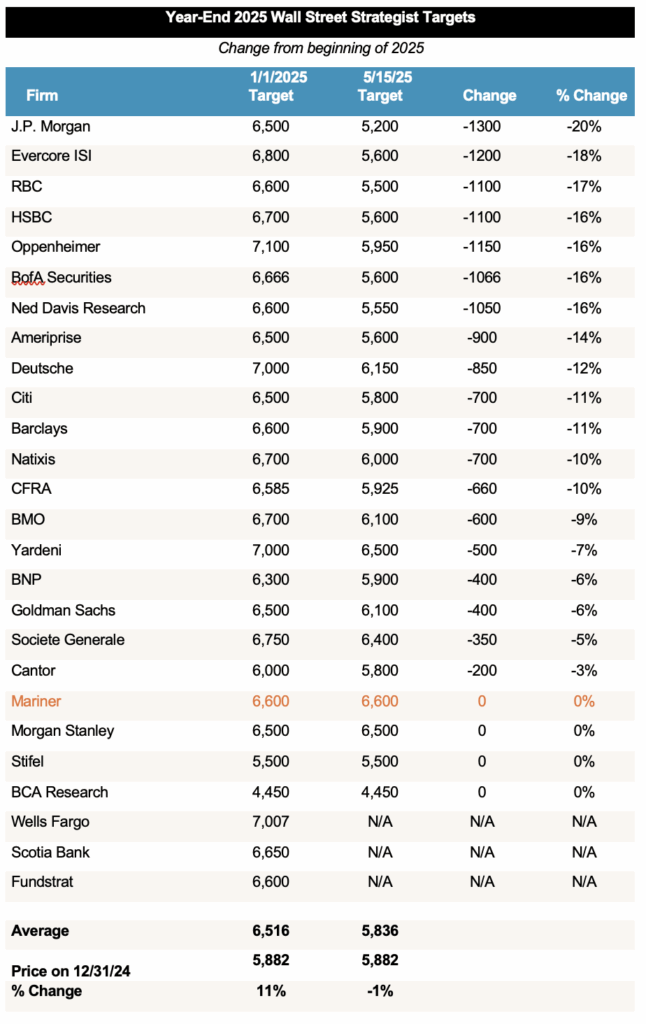
Data Sourced from Strategas as of 5/15/2025
We don’t think such actions by some of our well-known peers are helpful; in fact, they could be quite detrimental. We fall in the minority camp—populated by a few firms—that has held firm on our original constructive 2025 outlook throughout this first half of roller coaster news flow and returns.
We’ve also maintained this stance in our client communications regarding recommended positioning. Tactical adjustments and eliminating portfolio imbalances that may have occurred over the last several years of robust returns? Yes. We endorse such moderate and thoughtful actions, and we employ them. Extreme shifts in allocation and positioning when the FVTs remain supportive? No!
Mid-Year Data Releases and Occurrences Worth Mentioning
- Regarding recent fundamental data, releases have been mixed. Interest rates have stabilized for the present at comfortable levels, and the inflation data—for the most part—has been better than feared. Also, the negative trend in the confidence and sentiment data has settled down a bit. At the same time, some of the spending and demand side data has been weaker than expected—disappointing retail sales data for May, softening service and manufacturing PMI data, negative revisions to earlier BLS reports, and a slight deceleration in earnings growth expectations for 2025 (from low double digit to high single digit per consensus earnings forecasts).
While there are some signs of slowdown and “cracks” perhaps forming in the data, the overall mosaic remains solid. It’s way too premature to call fundamentals anything other than neutral to positive at this time! - The Fed’sJune meeting saw only minor changes in Fed expectations, and their overall message remains data dependent. They continue to pause and while they’re biased to cut in their next move, they feel it’s important to wait and see the actual tariff and fiscal policy decision outcomes and fundamental economic impacts before acting. We think this is wise and applaud their work.
In terms of their forecasts, they revised 2025 real GDP growth down slightly from 1.7% to 1.4%; their inflation forecast is up a bit from 2.8% at year-end 2025 to 3.1% due to tariff duty impacts; and their forecast for the U.S. unemployment rate at year end is up only slightly to 4.5% from 4.2%. This is all in keeping with our base case outlook. Their median “dot plot” matrix calls for a Fed Funds rate of 3.6% by sometime next year via two cuts in 2025 and only one in 2026—one less cut than they forecast in this exercise last quarter, but still a positive or accommodative signal. - Market technicals have improved. Investor sentiment is still poor or bearish, which is a contrarian positive. It’s stayed bearish despite this 20%+ rally in the S&P 500 following the April 8 TTO, which affirms this contrarian positive read.
Market momentum has improved notably since April 2. At that time, virtually no stocks were trading above their 50- and 200-day moving averages. Today, approximately 70% and 50% of stocks, respectively, are above those thresholds—signaling a shift from weak to more constructive momentum.4
On April 2, it felt like temporary drawdown levels or next support points could fall to the 4,300 level on the S&P 500 (which would have marked a 25% drawdown from market highs and a more typical average drawdown level for a bear market associated with fear of a looming recession); today, post-TTO recovery, we sense that the bottom or floor in the market has risen to 5000 or better with plenty of support at 5,300, 5,500, and 5,700.
Bottom-line, it appears to us that the spread in best case versus worst case outcomes that was very wide on April 2 has truncated handsomely since the TTO was announced and discussions of tax cuts have moved to front and center position. - The escalation of the Israel-Iran War is concerning and has certainly heightened fear of broader global conflict. That said, the fact that the S&P 500 has broken through to all-time highs (following these military initiatives and missile exchanges) affirms our observations above that a higher floor in the S&P 500 may have been established than feared on April 2.
Looking Ahead
Despite nail biting headlines and global news flow throughout the first half, U.S. and international equities have climbed this wall of worry and generated solid results so far.
What is our outlook going forward and what are the hurdles investors will face? We’ll explore all of this in detail in our Mid-Year 2025 Review and Crystal Ball presentation on July 24 at 3 p.m. CT.
Look for our formal announcements of this event, and please join us via Zoom! We’ll outline our continued constructive outlook for the markets and review the various risks and key wall of worry items that we’re monitoring.
Sources:
1-4FactSet
This commentary is provided for informational and educational purposes only. As such, the information contained herein is not intended and should not be construed as individualized advice or recommendation of any kind.
The opinions and forward-looking statements expressed herein are not guarantees of any future performance and actual results or developments may differ materially from those projected. The information provided herein is believed to be reliable, but we do not guarantee accuracy, timeliness, or completeness. It is provided “as is” without any express or implied warranties.
Asset allocation and diversification are investment strategies designed to help manage risk, but they do not ensure a profit or protect against loss in a declining market.
Equity securities are subject to price fluctuation and investments made in small and mid-cap companies generally involve a higher degree of risk and volatility than investments in large-cap companies. International securities are generally subject to increased risks, including currency fluctuations and social, economic, and political uncertainties, which could increase volatility. These risks are magnified in emerging markets.
Fixed-income securities are subject to loss of principal during periods of rising interest rates and are subject to various other risks including changes in credit quality, market valuations, liquidity, prepayments, early redemption, corporate events, tax ramifications, and other factors before investing. Interest rates and bond prices tend to move in opposite directions. When interest rates fall, bond prices typically rise, and conversely, when interest rates rise, bond prices typically fall.
There is no assurance that any investment, plan, or strategy will be successful. Investing involves risk, including the possible loss of principal. Past performance does not guarantee future results, and nothing herein should be interpreted as an indication of future performance. Please consult your financial professional before making any investment or financial decisions.
The S&P 500 is a capitalization-weighted index designed to measure the performance of the broad domestic economy through changes in the aggregate market value of 500 stocks representing all major industries.
Mag 7 stocks refer to Alphabet, Amazon, Apple, Meta, Microsoft, Nvidia and Tesla.
Mariner is the marketing name for the financial services businesses of Mariner Wealth Advisors, LLC and its subsidiaries. Investment advisory services are provided through the brands Mariner Wealth, Mariner Independent, Mariner Institutional, Mariner Ultra, and Mariner Workplace, each of which is a business name of the registered investment advisory entities of Mariner. For additional information about each of the registered investment advisory entities of Mariner, including fees and services, please contact Mariner or refer to each entity’s Form ADV Part 2A, which is available on the Investment Adviser Public Disclosure website. Registration of an investment adviser does not imply a certain level of skill or training.