Economic Outlook: ‘Three Yards and a Cloud of Dust’ Theme Playing Out
Read time: 9 minutes
I still maintain a 60% probability of our “Three Yards and a Cloud of Dust” theme working out. To recap, the “Three Yards” theme calls for 1.5% to 2.0% GDP growth for the full year and 3.0% inflation (core PCE)—both targets to occur in 2025. To put this in perspective, the average longer-term GDP growth rate in the U.S. (1960-2024) has been 3.0% and 2.3% over the shorter term (2000–2024). We’re coming off 2024’s growth of 2.4%.
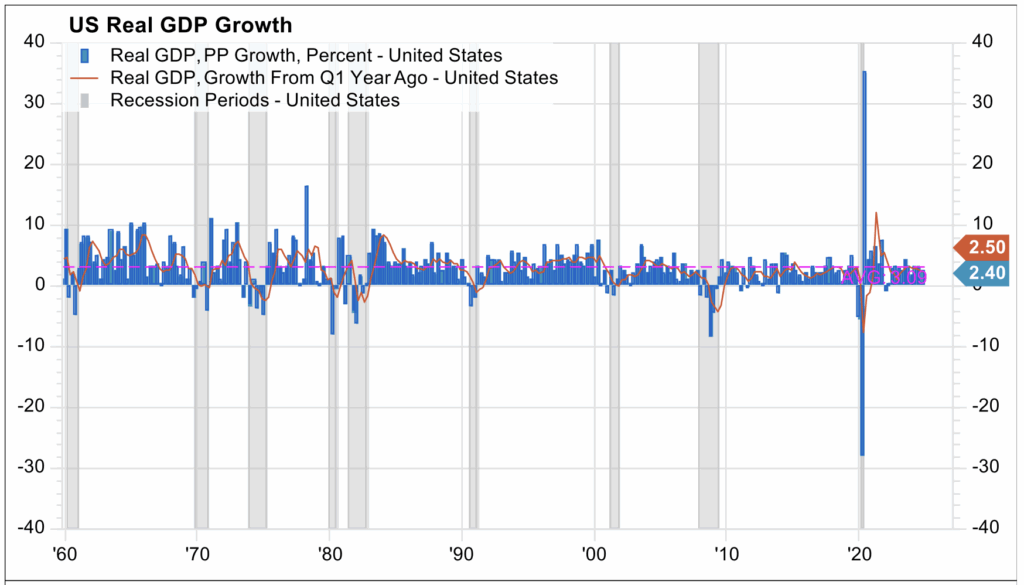
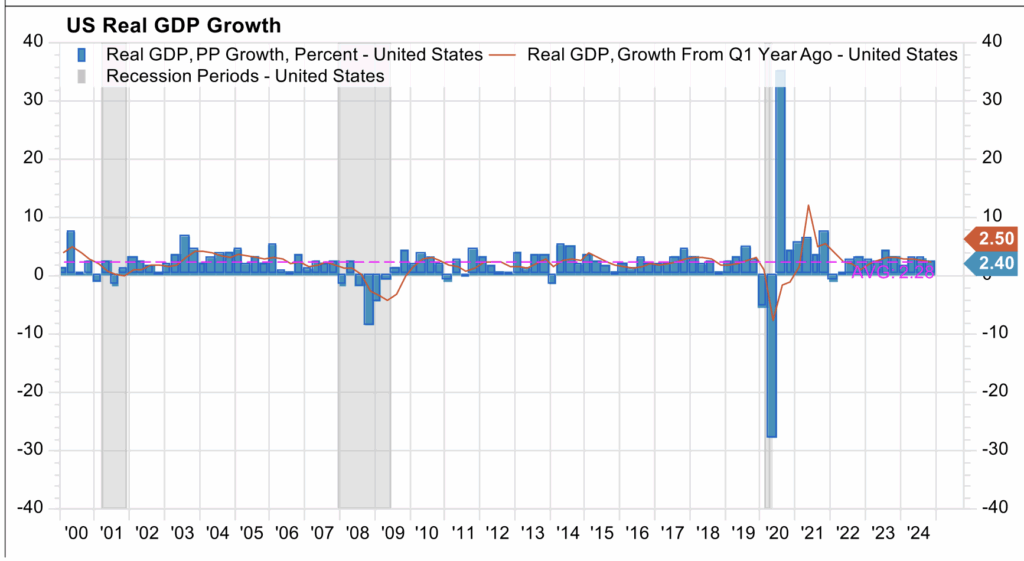
Source: FactSet
I’m expecting overall macro growth to slow down. This slowdown is being driven by uncertainty, which in turn is being driven by Trump’s “4 Buckets”—whose full impact probably won’t be felt until sometime late summer/early fall.
Until then, we have to track current activities to see how things are working out before that potential economic “tsunami” hits our shores. The uncertainty is driving the “cloud of dust,” or high uncertainty, in my core outlook.
I’ve been putting the odds of this theme playing out at 60%, which still holds.
Labor Market Softening
It’s hard for the economy to slip into an outright recession, as long as the jobs market remains robust. If people have jobs, they’re making money and they tend to spend it.
As most know, 70% of GDP activity comes from consumption, which is largely driven by people who have earned income to spend. That’s why job creation is a major driver of economic growth.
From a demographic standpoint, the U.S. economy needs to generate about 153,000 net new jobs each month for the economy to “tread water” and unemployment rates to remain steady. This is due to working-age population growth and labor participation rates.1
The institutional jobs data is released by the Labor Department on the first Friday of each month; each release is revised twice over the following two months following the initial release. From June 2024 through the end of last year, the initially reported/preliminary average month-over-month change in total non-farm payrolls—new jobs—was 173,000. These releases were later revised to roughly 174,500.
From a “net” seven-month standpoint, job creation was reasonably strong, and revisions were negligible on balance.2
This year through May, the average initial jobs creation report has remained reasonable, at an average of 167,600 rate. But the “revised” data paints a different picture, at 124,000 per month.2 This data suggests that the jobs market is starting to show some degree of weakening—not “weak,” mind you, but “weakening” in relation to data from 2024.
So, the revised 124,000 per month average is below both last year’s 179,000 monthly average for the same period, and below the needed “break-even” jobs creation rate of 153,000.
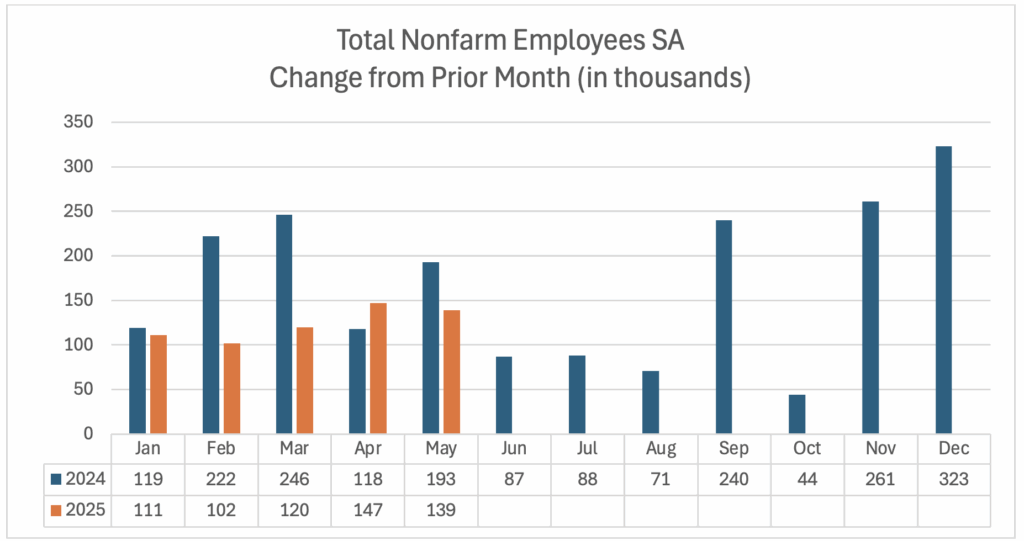
Source: Data sourced from the U.S. Bureau of Labor Statistics as of 5/31/2025
Some may suspect that much of the weakening in new job growth has been due to DOGE efforts to reduce headcount in the federal government, and to a certain degree this is true.
But let’s exclude government jobs creation data and look solely at “private” jobs creation rates: We see that the average jobs creation rate for the first five months of 2024 was 136,000, while the rate has averaged 117,000 for the first 5 months of 2025.
So, the private sector jobs creation rate has slowed by 14% over the last year.3
One specific area of job creation weakness has been the construction industry. For the first five months of 2024, we saw an average job creation rate of 17,800. In contrast, the first five months of this year generated an average job creation rate of 5,000. While the number of jobs isn’t the issue here, the weakness is notable.3
Again, a weakening picture, but not an outright “weak” picture.
Recession Probability Higher Than Normal
What about the other 40% outcome probability that isn’t covered under my “Three Yards” theme? I’m reserving that portion of the probability spectrum for an upcoming recession. The U.S. economy has been in recession 13% of the time since the end of WW2,4 so a 40% recession probability is higher than normal.
There are three factors, or models, we monitor that have given us a “heads-up” signal that a recession may be on the horizon: the PMI/ISM index, the six-month rate of change of the Leading Economic Index (LEI) and the shape of the U.S. Treasury yield curve.
- PMI/ISM Index
The latest PMI (Purchasing Managers’ Index), per the Institute of Supply Management, for the month of May showed the manufacturing PMI was 48.5 and the services PMI was 49.9.
Both indexes are pointing towards contraction (index levels below “50” indicate a contraction is occurring). While the manufacturing index has been lower than “50” for some time, the services index has just fallen below “50”.5 The PMI suggests that the probability of a recession is higher than normal.
- Six-Month Rate of Change of LEI
Data provided by The Conference Board shows that the latest six-month rate of change of the LEI of -2.7% is nearing the historical danger level of -4.1%. The six-month growth rate of the LEI has been consistently negative since early 2022, showing that the economic growth rate has been deteriorating for more than three years.6
- Shape of U.S. Treasury Yield Curve
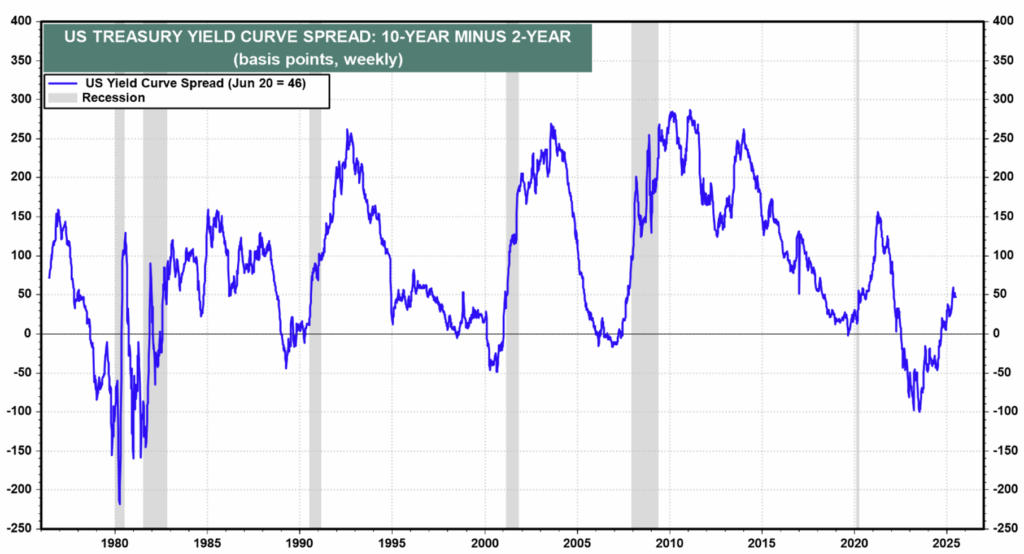
The yield “spread” between the 2-year and 10-year U.S. Treasury notes is currently positive as the 2-year yields 3.73% and the 10-year yields 4.29%. Historically, the shorter-term yield has been higher than the longer-term prior to recession events.
But note the fact that yield curves tend to move from negative back to positive prior to the start of recessions—which has happened recently. I’ve suggested (and written at length) that the yield curve’s value as a business cycle predictor been weakened—the issuance of massive amounts of private credit has dulled the macroeconomic impact of traditional banking credit.
Source: LSEG Datastream and @ Yardeni Research, and Federal Reserve.
So, let’s take stock of the three models above: we have a softening in the PMI data, softening in the LEI data and concerns about the reliability of the yield curve. My take is that while we’re experiencing a weakening in economic activity, the economy isn’t outright “weak” at this stage.
However, the data suggests that the probability of an upcoming recession is higher than historically normal levels, and we maintain our 40% outcome probability for an upcoming recession.
Monitoring Weakening Growth
As noted in earlier writings, I’m following short-term economic momentum changes. Why? Most of the data we have seen since some of President Trump’s “4 Buckets” have been (at least partially) implemented is “soft” data, as they have yet to fully impact real economic performance.
That said, I’m tracking the weekly change of three Federal Reserve branch banks’ economic momentum modeling activities. These banks take recently released economic data and compute what economic growth would be, absent future factors. If we compare current releases as compared to releases a month ago, we gain a sense of current, real-time economic growth momentum.
The three models which I’m monitoring are created by the Atlanta, New York and Dallas branches:
| Model | Current | Month Prior | Change |
|---|---|---|---|
| Atlanta “GDP Now” | 2.9% | 3.8% | -0.9% |
| New York “GDP Nowcast” | 1.7% | 2.4% | -0.7% |
| Dallas “GDP Modeling” | 2.4% | 1.8% | 0.6% |
| Average | 2.3% | 2.7% | -0.4% |
Data as of June 27th 2025
This provides further data of weakening economic growth that has been occurring. The first quarter GDP growth rate has been revised downward from an initial -0.2% growth contraction to -0.5%.7
If second quarter GDP growth was +2.3% as indicated by the three-bank modeled GDP growth expectation, 2025 GDP growth would have been +1.7% on a year-to-data annualized basis, very much in-line with our “Three Yards and a Cloud of Dust” growth expectation of 1.5% to 2.0%. And frankly, we’ve held our “Three Yards” view all year, without wavering.
The wait continues to see how Trump’s “Buckets” impact real economic activity. Speculation is centered on expectations that when all the “Buckets” are in full bloom, we’ll see a negative impact on GDP growth and an upside push on inflationary pressures. Higher trends of stagflation may be at hand. But we’ll see: the jury is still out.
Sources:
2U.S. Bureau of Labor Statistics, https://www.bls.gov/web/empsit/cesnaicsrev.htm
3U.S. Bureau of Labor Statistics, https://www.bls.gov/ces/data/employment-and-earnings/2025/home.htm
4National Bureau of Economic Research, https://www.nber.org/research/data/us-business-cycle-expansions-and-contractions
5Institute of Supply Management, https://www.ismworld.org/supply-management-news-and-reports/reports/ism-report-on-business/pmi/may/, https://www.ismworld.org/supply-management-news-and-reports/reports/ism-report-on-business/services/may/
6The Conference Board, https://www.conference-board.org/topics/us-leading-indicators
7Bureau of Economic Analysis, https://www.bea.gov/sites/default/files/2025-06/gdp1q25-3rd.pdf
This commentary is provided for informational and educational purposes only. As such, the information contained herein is not intended and should not be construed as individualized advice or recommendation of any kind.
The opinions and forward-looking statements expressed herein are not guarantees of any future performance and actual results or developments may differ materially from those projected. The information provided herein is believed to be reliable, but we do not guarantee accuracy, timeliness, or completeness. It is provided “as is” without any express or implied warranties.
There is no assurance that any investment, plan, or strategy will be successful. Investing involves risk, including the possible loss of principal. Past performance does not guarantee future results, and nothing herein should be interpreted as an indication of future performance. Please consult your financial professional before making any investment or financial decisions.
Mariner is the marketing name for the financial services businesses of Mariner Wealth Advisors, LLC and its subsidiaries. Investment advisory services are provided through the brands Mariner Wealth, Mariner Independent, Mariner Institutional, Mariner Ultra, and Mariner Workplace, each of which is a business name of the registered investment advisory entities of Mariner. For additional information about each of the registered investment advisory entities of Mariner, including fees and services, please contact Mariner or refer to each entity’s Form ADV Part 2A, which is available on the Investment Adviser Public Disclosure website. Registration of an investment adviser does not imply a certain level of skill or training.

